Market Summary
While the broad markets were extremely volatile during 2022, with multiple mini rallies but ultimately finishing down for the year, major indexes posted solid positive results for the fourth quarter. Better than expected corporate earnings reports, a pullback in commodity prices and cooling inflation data fueled the market’s appetite for capital assets.
The S&P 500 declined -18.1% in 2022, after gaining 7.6% in the 4th quarter. The Russell 3000 Value declined only -8.0% during the year, increasing over 12% during the final three months. Only a monthly basis, Value indexes outperformed Growth fairly consistently over the course of the year, with the Russell 3000 Growth ultimately falling -29.0% in 2022.
During the most recent Federal Reserve Board meeting, the central bank raised its benchmark interest rate by 0.5%, taking it to a target range of 4.25% to 4.50%. The half-point increase follows four consecutive hikes of 0.75%. The Fed slightly eased the pace of tightening as it balances the need to tame soaring consumer prices in an effort to prevent the economy from falling into a recession. After a difficult two years, inflation does appear to be loosening its grip on the economy, which is encouraging. Overall, the Consumer Price Index increased by a mere 0.1% in November, with the annual rate falling from 7.7% to 7.1%. Meanwhile, the unemployment rate held steady at 3.7%, remaining historically low; however, layoffs are on the rise and we expect the trend to continue.
Many businesses have announced plans to reduce staff including Meta, Cisco, Amazon, Salesforce, Twitter, Morgan Stanley and Goldman Sachs, mostly due to adjustments in business plans as they overstaffed during the pandemic.
Performance Highlights
The Snow SMID Cap Value strategy outpaced the benchmark by 336 basis points during the quarter, rallying 12.57% gross of fees (12.39% net of fees), while the Russell 2500 Value index gained only 9.21%. For the year, the strategy outperformed the benchmark by 608 basis points, returning -7.00% gross of fees (-7.61% net of fees), while the Russell 2500 Value declined -13.08%.
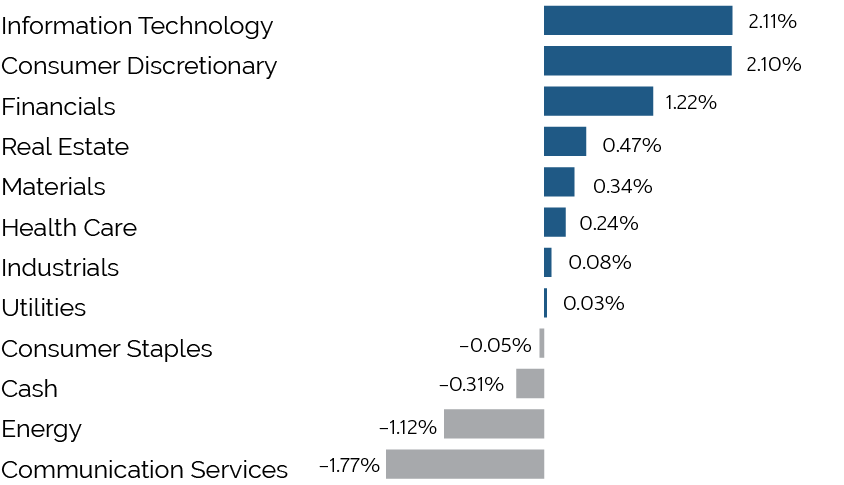
The Snow SMID Cap Value strategy’s strong relative performance for the quarter was entirely driven by stock selection, as sector positioning detracted from relative performance. Stock selection in Information Technology, Consumer Discretionary and Financials lead the way, while the only two sectors that had negative stock selection were Communication Services and Energy. From a sector positioning perspective, the portfolio was negatively impacted by an underweight to Industrials, overweight to Information Technology and its cash position as the market rallied sharply.
Portfolio Attribution
Top 5 Performance Contributors
| Stock | Avg Weight % | Contribution % |
|---|---|---|
| Super Micro Computer | 4.08 | 1.76 |
| Modine Manufacturing | 2.84 | 1.39 |
| Commerical Metals | 3.08 | 0.98 |
| American Equity Investments | 4.04 | 0.94 |
| American Eagle Outfitters | 2.60 | 0.89 |
Super Micro Computer (SMCI)
Shares of SMCI appreciated during the quarter as the company issued an upbeat earnings report and forecast. The company continues to execute on growth initiatives and is taking share in the server market. Despite the rise in the stock, we believe the stock remains significantly undervalued, trading for approximately 9x forward earnings estimates.
Modine Manufacturing (MOD)
MOD stock price spiked after reporting their quarterly results, which showed strong results across all segments. Even with the recent movement, MOD trades at a reasonable valuation, with room for continued upside as the company continues to execute on new initiatives.
Commercial Metals (CMC)
Shares of CMC positively contributed to performance as the market began to appreciate the company’s longer-term earnings power. The company also provided an upbeat outlook, bucking recessionary concerns, reporting that despite slowing residential demand, commercial and industrial indicators remain strong. CMC has momentum from idiosyncratic factors including the closing of the Tensar acquisition, leading market share in the US, benefits from the infrastructure bill, and augmented rebar capacity.
Top 5 Performance Detractors
| Stock | Avg Weight % | Contribution % |
|---|---|---|
| Cinemark Holdings | 2.28 | -0.79 |
| Lions Gate Entertainment | 2.54 | -0.65 |
| Lincoln National | 1.92 | -0.58 |
| Hasbro | 1.37 | -0.13 |
| Silicon Motion Technology | 2.48 | -0.11 |
Cinemark (CNK)
CNK shares detracted from performance alongside the broad decline in Consumer Discretionary stocks. Despite an encouraging third quarter report, shares sold off in December as the opening weekend box office result for Avatar: The Way of Water fell short of expectations. CNK has demonstrated share gains versus pre-pandemic levels and is positioned for significant earnings recovery as the box office recovers.
Lions Gate Entertainment (LGF)
LGF pulled back during the quarter after announcing they would pivot their strategic review to focus on their Studio assets, after spending nearly a year attempting to sell or separate their STARZ business. While we still see substantial value in the underlying title library that they license to other platforms, we have reduced our position given increasing stress on the balance sheet as costs bloat and free-cash-flow compresses.
Lincoln National (LNC)
LNC underperformed during the quarter after the company announced weaker results, which were impacted by a reserve charge to their life insurance business. LNC management has taken appropriate action to improve reserves and continue to focus on earnings growth. The valuation has become more attractive given the stock weakness and the limited impact on earnings.
Trailing Performance
*As of December 31, 2022
| QTD | 1 Yr | 3 Yr | 5 Yr | 7 Yr | Since Inception** | |
|---|---|---|---|---|---|---|
| Composite (Gross) | 12.57% | -7.00% | 12.69% | 7.69% | 10.10% | 7.35% |
| Composite (Net) | 12.39% | -7.61% | 11.97% | 7.00% | 9.39% | 6.65% |
| Russell 2500 Value | 9.21% | -13.08% | 5.21% | 4.75% | 8.25% | 7.28% |
Calendar Year Performance
| 2022 | 2021 | 2020 | 2019 | 2018 | 2017 | 2016 | 2015 | 2014 | 2013 | |
|---|---|---|---|---|---|---|---|---|---|---|
| Composite (Gross) | -7.00% | 27.30% | 20.91% | 24.22% | -18.53% | 11.54% | 21.41% | -16.47% | 6.13% | 10.87% |
| Composite (Net) | -7.61% | 26.49% | 20.14% | 23.43% | -19.07% | 10.82% | 20.63% | -17.02% | 5.45% | 10.63% |
| Russell 2500 Value | -13.08% | 27.78% | 4.88% | 23.56% | -12.36% | 10.36% | 25.20% | -5.49% | 7.11% | 8.83% |
Source: SEI Global Services
* Returns for periods greater than a year are annualized. Past performance is not indicative of future results.
** Inception: 09/30/13
Top 10 Holdings
| American Equity Investments | 4.58% |
| Super Micro Computer | 4.14% |
| Brinker International | 3.59% |
| ABM Industries | 3.51% |
| Photronics | 3.48% |
| Centene | 3.46% |
| Commercial Metals | 3.26% |
| CNO Financial Group | 3.16% |
| Delek US Holdings | 3.07% |
| American Eagle Outfitters | 2.85% |
| Total | 35.10% |
|---|
Total Effect Attribution vs Russell 2500 Value
Outlook
As we have discussed in the past, we believe the economy is in a period of higher structural inflation and we expect it to remain above its long-term average. This environment bodes well for the value style given its historical correlations with increasing interest rates and rising inflation. Furthermore, from a growth and value index construct perspective, the largest relative sector weights in the value index are Financials and Energy, both of which are poised to perform well going forward.
Disinflation and global economic desynchronization will be the dominant macro themes for 2023. With fears of a recession looming and the central bank in an aggressive tightening cycle, the path for a soft landing is narrowing.
Variables including employment, interest rates and consumer price index reports will likely keep volatility levels elevated and pressure on capital asset prices. In our view, given the array of macroeconomic headwinds, the direction of equity prices will be more modest and driven by idiosyncratic reasons.
The consistent application of our investment approach has led to strong performance over all types of market environments. In turn, we continue to hold companies with compelling business fundamentals, skilled management teams, reoccurring cash flows and the flexibility to adapt to an inflationary environment.
We believe the strong cash flow generation and capital flexibility of our businesses will provide meaningful protection if market fundamentals deteriorate. Our portfolio of stocks is significantly discounted based on relative multiple valuations, compared to its benchmark. We remain dedicated to delivering strong long-term performance and transparent communications to our investors. As always, we welcome your comments and questions. Thank you for your commitment to Easterly Investment Partners.
Disclosures
Easterly Investment Partners (EIP) is a registered investment adviser. Registration of an Investment Advisor does not imply any level of skill or training. This composite has been assigned to Easterly Investment Partners (EIP) effective July 1, 2021. Performance presented prior to July 1, 2021, occurred while the Portfolio Manager(s) and the research team were affiliated with a prior firm (Snow Capital Management, L.P.). EIP claims compliance with the Global Investment Performance Standards (GIPS®). A fully compliant GIPS presentation along with a complete list and description of all composites is available upon request. The SMID Cap Value composite contains fully discretionary commission accounts where approximately 85% (+/10%) of the assets are invested in the Small Cap Value strategy and 15% (+/-10) of the assets are invested in the companies within the range of market caps defined by the Russell 2500 Value Index. The U.S. Dollar is the currency used to express performance. Leverage is not used in this composite. Investing involves risk; clients may experience a profit or a loss. In addition to the normal risks associated with investing, investments in smaller companies typically exhibit higher volatility. Past performance is not indicative of future results. Performance is preliminary. Composite returns are shown gross of fees and do not reflect the deduction of advisory fees. Actual returns are shown gross of fees and do not reflect the deduction of advisory fees. Actual returns will be reduced by advisory fees and other expenses incurred in the management of the account. EIP’s advisory fees are outlined in our Form ADV Part 2A (Brochure), which is available upon request. The effect of an advisory fee compounded over a period of years, on the total value of a client’s portfolio is represented by the following example.
Assuming an initial portfolio of $1 million earning a 10% return each year which incurs an annual advisory fee of 1.0% payable quarterly in advance, the portfolio would be worth $1.53 million net of fees and $1.61 million gross of fees after 5 years, $2.37 million net of fees and $2.59 million gross of fees after 10 years and $3.58 million net of fees and $4.15 million gross of fees after 15 years. Past performance is not guarantee of future results. The performance of any individual portfolio may vary from the Composite’s performance.
The views expressed herein are solely the opinions of EIP. We make no representations as to their accuracy. This communication is intended for informational purposes only and does not constitute a solicitation to invest money nor a recommendation to buy or sell certain securities.
The performance figures are based on a composite of many accounts and not all accounts owned the securities mentioned in this commentary. Holdings and sector allocations are subject to change. The latest copy of our Form ADV Part 2A (Brochure) and a complete list and description of EIP’s composites and/or a presentation that adheres to the Global Investment Performance Standards (GIPS®) is available upon request.
Russell 2500® Value Index
The Russell 2500 Value Index measures the performance of those Russell 2500 companies with lower price-to-book ratios and lower forecasted growth values. Indexes are unmanaged. It is not possible to invest directly in an index.