Economy and Rates
We expect continued volatility in 2024. The market, however, is currently pricing in a soft/no landing scenario. Historically, the U.S. has experienced a recession approximately 10 quarters after the Fed has initiated a tightening cycle. Q1 2024 is the seventh quarter after the most recent tightening. Additionally, a prolonged inversion of the yield curve has historically been an indicator consistent with a future recessionary environment. Consumer spending was resilient in 2023 and contributed significantly to the strong growth. However, as excess savings from the pandemic are depleted, we expect to see an increase in the savings rate, which may tip the economy into a negative real growth rate.
2024 should bring a tug of war between deflationary and inflationary forces. On the deflationary side, the expected decline in consumer demand will continue to put pressure on prices of durable goods. Additionally, an accelerated slowdown in housing activity and residential investment will likely contribute to deflationary forces. That being said, steady wage increases and a rise in unit labor costs will add to service inflation, potentially forcing companies to pass on costs to the price of final goods, or face falling profit margins. Given the elevated share of nominal GDP by corporate profits, we do not believe that it will be feasible for companies to continue to raise prices and they will be forced to reduce their labor force at some point in the year.
We anticipate that the Fed will initiate its rate cutting program at the end of Q2 or as early as Q3, and implement four rate cuts by the end of 2024, putting the Fed Funds rate in the 4.25-4.5 range. We believe it is a fool’s errand to make any predictions regarding the direction of long-term Treasury rates given the number of factors that influence interest rate volatility. It is interesting to observe the futility of professional forecasters in predicting 10-year Treasury rates out four quarters, which Figure 1 illustrates. Over the past 25 quarters, the 10-year forecast has been off, on average, by 40bp out one quarter, 70bp out two quarters, 80bp out three quarters, and 110bp out four quarters.
Directionally, the forecast has overstated the actual 10-year rate as often as understating it. Bottom line: it is very difficult to forecast 10-year Treasury rates.
Figure 1. Source: Federal Reserve Bank of Philadelphia and Bloomberg as of 11/28/2023.
Difficulty of Forecasting 10-Year Treasury Rates out 4 Quarters
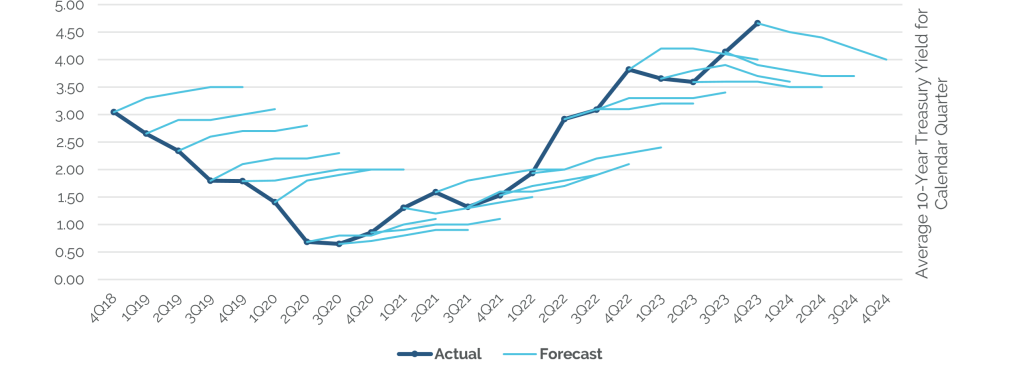
Figure 2
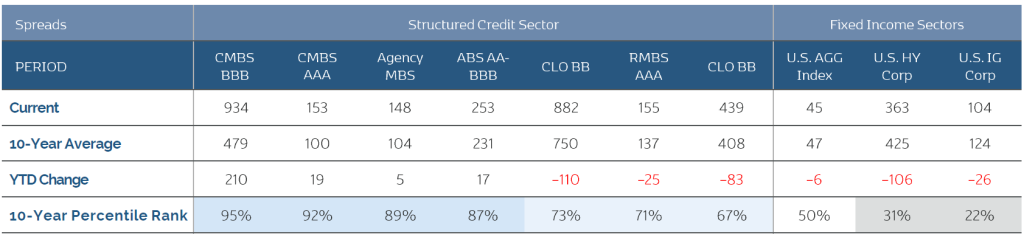
Source (Figures 2 & 3): Orange Investment Advisors, Bloomberg, J.P. Morgan, BofA, Wells Fargo. As of 12/12/2023.
US AGG Index: Bloomberg U.S. Aggregate Bond Index; Agency MBS: 30-Year FNCL Par Coupon Index; U.S. IG Corp: Bloomberg U.S. Corporate Index; U.S. HY Corp: Bloomberg U.S. Corporate High Yield Index Leveraged Loans: Credit Suisse Liquid Leveraged Loan Index; CMBS AAA: J.P. Morgan (Mar 2019-Present); BofA (Dec 2013-Mar2019).
RMBX Non-QM AAA: Wells Fargo; start date: 12/23/2016; ABS-AA-BBB; ICE BofA AA-BBB U.S. Fixed Rate Miscellaneous ABS Index; CLO: J.P. Morgan Indexes
Credit Spreads
Structured Credit – every major Structured Credit sector is trading at spreads wider than the median over the last 10 years. CMBS, both AAA and BBB credits, are trading at spreads above the 90th percentile. Structured Credit continues to offer the most relative value amongst traditional fixed income sectors. The differential between new issue CMBS BBB- spreads and high yield corporates is currently in the 99.9 percentile over the last 10-years (see Figure 3).
Corporates – with the current High Yield (HY) spread of 334bp, we believe this does not compensate investors for the macro risks and the corresponding spread volatility.
U.S. Corporate HY option adjusted spreads are in the 15th percentile, based on the last 10 years, and we expect HY spreads to widen by approximately 100bp in 2024. Similarly, Investment Grade (IG) Corporate spreads are trading at 103bp, in the 22nd percentile based on the same period. We think that IG credit has less downside in a recessionary scenario given the overall health of corporate balance sheets.
Figure 3. Source: Orange Investment Advisors as of 12/12/2023 (see disclosure above)
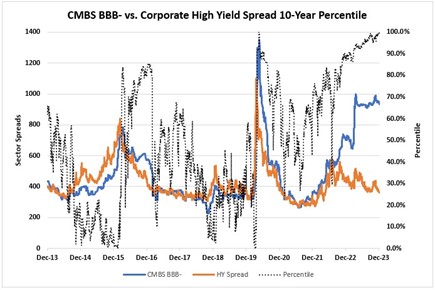
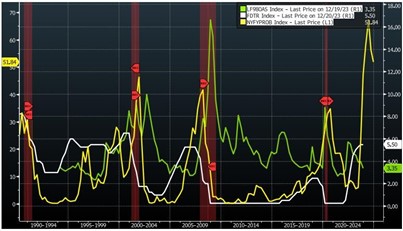
Figure 4 highlights HY Corporate spreads (green line) versus easing cycles (white line) and the New York Fed Recession Probability Model (yellow line), with actual recessions shaded in red. The current probability of recession per the New York Fed Model (51.8%) is higher than its level during the last four actual recessions. It is also clear that each of the last four Fed easing cycles were accompanied by a recession. Finally, it is apparent that HY Corporate spreads widen significantly during recessions, where they have been tightening steadily since mid-2022.
Figure 4. Source: Bloomberg as of 12/29/2023
Structured Credit Markets
Agency MBS – currently trading at wide levels relative to historical spread levels. At 148bp, the current coupon Agency MBS is close to the 89th percentile based on the last 10years. We believe the Fed’s pace of QT will slow down toward the end of 2024 and MBS net supply could decline further given a slowdown in the housing market. Marginal flows into fixed income funds should help bolster some demands for Agency MBS and we see spreads tightening from these wide levels.
Non-Agency RMBS – had a very strong year in 2023, with spreads tightening by 65bp for AAAs to as much as 200bp for select BBBs. The sector continues to be supported by a robust housing market with nationwide home prices climbing by 3.9% year-over-year (YoY) despite 7% mortgage rates. We see plenty of price upside in the more esoteric segments of RMBS like Private Reverse RMBS deals, many of which have not participated in the latest spread rally and can be purchased at double digit yields. We also continue to like the Legacy RMBS segment that has been slow to react to the spread rally due to poor sponsorship and persistent fund outflows from mutual funds that typically traffic in that diminishing space.
CMBS – spreads widened across the capital structure in 2023. AAA Conduit LCFs (last cashflows) widened by nearly 20bp while on-the-run Conduit BBB-tranches saw over 200bp of spread widening. AAA through BBB-CMBS spreads are currently in 92-95th percentile based on the last 10-years with only a brief period of Covid-19 related widening in March and April of 2020 offering better value. CMBS sectors are facing two major issues, cap rate expansions and structural problems in office and retail. We believe that current CMBS Conduit and SASB valuations already reflect the worst-case scenarios and expect many problematic loans to be resolved via maturity extensions, forbearance plans and other types of modifications, rather than be liquidated in a fire sale. We believe that in 2024 we are going to see more private capital raised for distressed situations flow into the CMBS space and, given limited issuance (57% decline YoY in private label issuance in 2023), we expect CMBS spreads to firm up as money pours into the higher echelons of the CMBS credit market.
ABS – experienced marginal spread tightening in 2023 with the Bank of America AA-BBB Asset Backed Securities index posting a 6.1% return through the end of November. ABS sectors remain cheap from a relative basis against similar duration IG Corporates, with current ABS spreads in the 87th percentile over the last 10years. While ABS sectors benefit from structural credit protections offered in securitizations, we plan on staying higher in the credit stack as we expect a decent amount of spread volatility in 2024. We also think that 2023 underwritten deals will benefit from stronger underwriting in a rising rate environment, and we will prefer these recent deals to 2021-2022 pre-rate hike collateral.
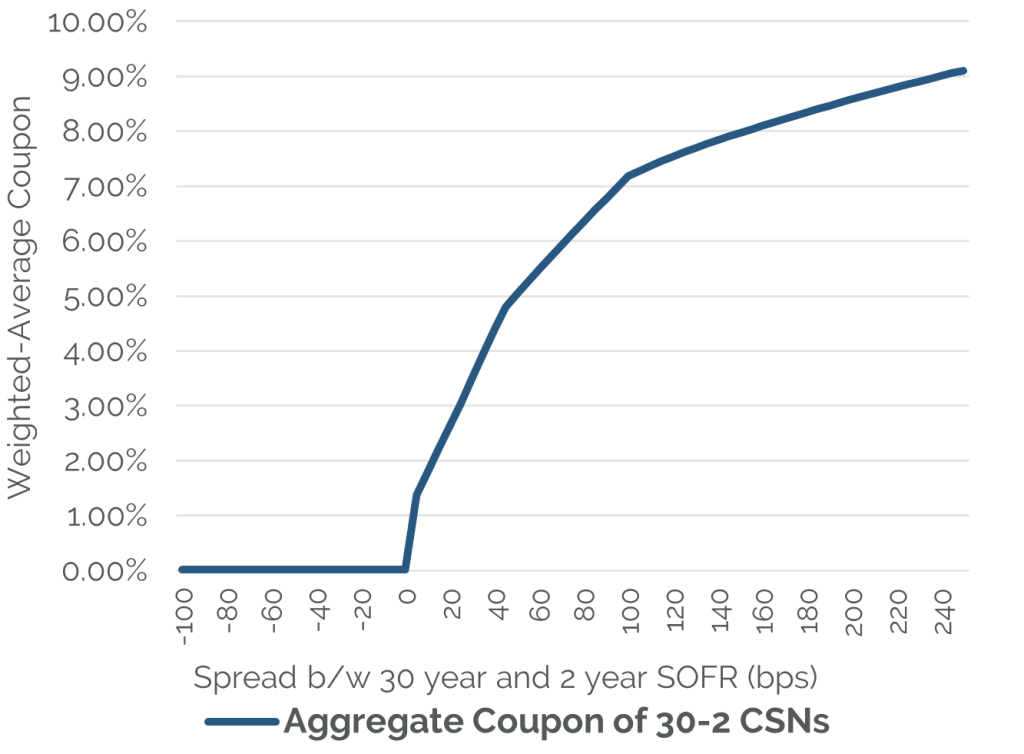
Corporate Structured Notes (CSNs) – issued by banks and financial institutions, are very attractively priced relative to IG corporate bullet bond. CSNs, like CMS spread floaters, currently offer 200-250bp of spread pick up relative to bullets, as they are priced in high 50s and low 60s with 4.5+% yields as zero-coupon bonds. CSNs provide great exposure to yield curve steepening and will start paying interest as soon as the yield curve re-inverts and normalizes to its long-term steady state. Figure 5 shows the weighted average coupon of the CSN position as a function of the steepness of the SOFR curve from the 2-year to the 30-year point. We think there is a high probability of significant yield curve steepening in 2024, resulting in a potential 10-15% gain in these CSNs from a combination of curve steepening and spread compression.
Figure 5. Source: Orange Investment Advisors and Bloomberg as of 12/31/2023.
Corporate Structured Note Weighted Average Coupon vs Yield Slope
GIPS® Report
Orange Investment Advisors Structured Credit Value Strategy Composite
Composite Inception Date: September 1, 2018
Composite Creation Date: July 2018
| Year End | Composite Performance | Annualized 3-Year Standard Deviation | Total Assets | |||||||
|---|---|---|---|---|---|---|---|---|---|---|
| Gross | Actual Net | Model Net | Benchmark | Composite | Benchmark | Internal Dispersion | Firm | Composite | Number of Accounts | |
| 2022 | -4.85% | -6.27% | -5.47% | -13.01% | 5.88% | 5.85% | N/A | 526.47 | 327.74 | 1 |
| 2021 | 6.36% | 4.79% | 5.67% | -1.54% | 5.37% | 3.40% | N/A | 422.64 | 294.19 | 1 |
| 2020 | 15.74% | 14.05% | 15.00% | 7.51% | N/A | N/A | N/A | 277.48 | 193.05 | 1 |
| 2019 | 8.92% | 7.31% | 8.21% | 8.72% | N/A | N/A | N/A | 39.74 | 39.74 | 1 |
| 2018 | 1.96% | 1.46% | 1.74% | 0.98% | N/A | N/A | N/A | 35.76 | 35.76 | 1 |
Firm Definition
Orange Investment Advisors is a Fixed income investment manager that invests primarily in U.S.-based Structured Credit securities. Orange Investment Advisors is defined as an independent investment management firm that is not affiliated with any parent organization. Policies for valuing investments, calculating performance, and preparing GIPS reports are available upon request.
Firm Verification Statement
Orange Investment Advisors claims compliance with the Global Investment Performance Standards (GIPS®) and has prepared and presented this report in compliance with the GIPS standards. Orange Investment Advisors has been independently verified for the periods August 1, 2018 through December 31, 2021. The verification report is available upon request. A firm that claims compliance with the GIPS standards must establish policies and procedures for complying with all the applicable requirements of the GIPS standards. Verification provides assurance on whether the firm’s policies and procedures related to composite and pooled fund maintenance, as well as the calculation, presentation, and distribution of performance, have been designed in compliance with the GIPS standards and have been implemented on a firmwide basis. Verification does not provide assurance on the accuracy of any specific performance report. This composite was created in July 2021, and the inception date is September 1, 2018. A list of composite descriptions and a list of limited distribution pooled funds are available upon request.
Composite Description
The Structured Credit Value Strategy Composite includes all fee paying SMAs and Funds that invest in Structured Credit based on Orange’s Active Value Security Selection approach which is a bottom-up, value-based investment strategy. The strategy seeks to provide a high level of income and total return with low sensitivity to interest rates and credit spreads by taking advantage of opportunities in the inefficient and non-indexed structured credit market. Derivatives, including options, futures, and swaps, and short positions may be used, primarily for hedging or managing certain risks, including interest or credit spread risk. The account minimum for the composite is $1 million.
Benchmark Description
The benchmark for the composite is the Barclays Bloomberg U.S. Aggregate Bond Total Return Index. Index returns reflect the reinvestment of income, but do not include any expenses, such as transaction costs and management fees.
Performance Calculation
Valuations are computed and performance is reported in U.S. dollars.
Returns include the reinvestment of income and are presented gross and net of fees. Gross returns are net of transaction costs. Actual net returns are net of actual transaction costs, management fees, as well as other fund operating fees and expenses. Model net returns are supplemental to actual net returns and are calculated by reducing the monthly composite gross return by a model fee of 0.05417%, which equates to an annual model fee of 0.65%, the highest fee charged to any SMA client. Actual fees may vary depending on, among other things, the applicable fee schedule and portfolio size. Past performance does not guarantee future results.
Investment Management Fee Schedule
The standard annual fee schedule is: 0.65% on the first $100 million, 0.55% on the next $150 million, and 0.45% on all assets above $250 million under management.
Composite Dispersion
Internal dispersion is calculated using the equal-weighted standard deviation of annual gross returns of those portfolios that were included in the composite for the entire year. It is not presented (“N/A”) when there are five or fewer portfolios in the composite for the entire year.
Standard Deviation
The three-year annualized standard deviation measures the variability of the composite gross returns and the benchmark returns over the preceding 36-month period.
Trademark
GIPS® is a registered trademark of CFA Institute. CFA Institute does not endorse or promote this organization, nor does it warrant the accuracy or quality of the content contained herein.
Important Disclosures
© 2024. Easterly Asset Management. All rights reserved.
Easterly Asset Management’s advisory affiliates (collectively, “EAM” or “the Firm”), including Easterly Investment Partners LLC,Easterly Funds LLC, and Easterly EAB Risk Solutions LLC (“Easterly EAB”) are registered with the SEC as investment advisers under the Investment Advisers Act of 1940, as amended. Registration does not imply a certain level of skill or training. More information about the firm, including its investment strategies and objectives, can be found in each affiliate’s Form ADV Part 2which is available on the www.sec.govwebsite. This information has been prepared solely for the use of the intended recipients; it may not be reproduced or disseminated, in whole or in part, without the prior written consent of EAM.
No funds or investment services described herein are offered or will be sold in any jurisdiction in which such an offer or sale would be unlawful under the laws of such jurisdiction. No such fund or service is offered or will be sold in any jurisdiction in which registration, licensing, qualification, filing or notification would be required unless such registration, license, qualification, filing, or notification has been effected.
The material contains information regarding the investment approach described herein and is not a complete description of the investment objectives, risks, policies, guidelines or portfolio management and research that supports this investment approach. Any decision to engage the Firm should be based upon a review of the terms of the prospectus, offering documents or investment management agreement, as applicable, and the specific investment objectives, policies and guidelines that apply under the terms of such agreement. There is no guarantee investment objectives will be met. The investment process may change over time. The characteristics set forth are intended asa general illustration of some of the criteria the strategy team considers in selecting securities for client portfolios. Client portfolios are managed according to mutually agreed upon investment guidelines. No investment strategy or risk management techniques can guarantee returns or eliminate risk in any market environment. All information in this communication has been obtained from sources believed to be reliable but cannot be guaranteed. Investment products are not FDIC insured and may lose value.
Investments are subject to market risk, including the loss of principal. Nothing in this material constitutes investment, legal,accounting or tax advice, or a representation that any investment or strategy is suitable or appropriate. The information contained herein does not consider any investor’s investment objectives,particular needs, or financial situation and the investment strategies described may not be suitable for all investors. Individual investment decisions should be discussed with a personal financial advisor.
Any opinions, projections and estimates constitute the judgment of the portfolio managers as of the date of this material, may not align with the Firm’s opinion or trading strategies, and may differ from other research analysts’ opinions and investment outlook. The information herein is subject to change without notice and may be superseded by subsequent market events or for other reasons. EAM assumes no obligation to update the information herein.
References to securities, transactions or holdings should not be considered a recommendation to purchase or sell a particular security and there is no assurance that, as of the date of publication, the securities remain in the portfolio. Additionally, it is noted that the securities or transactions referenced do not represent all of the securities purchased, sold or recommended during the period referenced and there is no guarantee as to the future profitability of the securities identified and discussed herein. As a reminder, investment return and principal value will fluctuate.
The indices cited are, generally, widely accepted benchmarks for investment performance within their relevant regions, sectors or asset classes, and represent non managed investment portfolio. It is not possible to invest directly in an index.
This communication may contain forward-looking statements, which reflect the views of EAM and/or its affiliates. These forward-looking statements can be identified by reference to words such as “believe”, “expect”, “potential”, “continue”, “may”, “will”, “should”, “seek”, “approximately”, “predict”, “intend”, “plan”, “estimate”, “anticipate” or other comparable words. These forward-looking statements or other predications or assumptions are subject to various risks, uncertainties, and assumptions. Accordingly, there are or will be important factors that could cause actual outcomes or results to differ materially from those indicated in these statements. Should any assumptions underlying the forward-looking statements contained herein prove to be incorrect, the actual outcome or results may differ materially from outcomes or results projected in these statements. EAM does not undertake any obligation to update or review any forward-looking statement, whether as a result of new information, future developments or otherwise, except as required by applicable law or regulation.
Past performance is not indicative of future results.
20240110-3318783