Market Summary
Major market indices declined during the quarter as investors digested inflation and the Federal Reserve’s (Fed) interest rate policy. Across the market cap size and style spectrum, there was dispersion of results. In large caps, growth and value indices were essentially in-line for the quarter, but large cap growth indices continue to significantly outperform large cap value year-to-date. On the small cap side, value outperformed growth during the quarter, and the year-to-date spread between growth and value is much narrower.
Seven S&P 500 companies – Apple, Microsoft, Amazon, Google, Nvidia, Tesla, and Meta (Facebook) – have remained top of mind for many investors this year. These companies, which have been dubbed the “Magnificent Seven”, are the largest U.S. based companies by market cap and have driven a large portion of the broad markets return for the year-to-date period. They only represent 28% of the S&P 500 Index, but contributed almost 65% of the S&P 500 Index year-to-date return. This narrow leadership has led to a market that is trading at heightened valuations, with the forward price-to-earnings (P/E) multiple of the S&P 500 at close to 18x. The spread between the average P/E ratio for the seven largest companies in the S&P 500 and that of the rest of the index has rarely been this wide. If you disregard the Magnificent Seven and look under the hood, you will find the market is cheaper, at approximately 16x forward earnings; however, the last time the 10-year UST was 4.69% was in October of 2007 when the forward P/E of the S&P 500 was only 12.5x next years earnings. In turn, the broad market, indicated by the S&P 500, is still at a heightened valuation. Perhaps more important to some investors, the yield on three-month Treasury bills now exceeds the earnings yield — the inverse of the P/E ratio— for the S&P 500, excluding the top seven, by close to 1.2%. It is the first time the yield on T-bills exceeds the group’s earnings yield since 2000 and is the third-highest spread favoring T-bills on record.
The recent, sharp rise in yields has created a challenging investment backdrop. During the quarter, the benchmark 10-year UST increased from 3.81% to 4.59%. The swift move in Fed Funds to 5.5% should begin to dampen growth. The longer rates stay elevated, the larger the economic drag will be, as more and more activity will be subject to higher rates. A related detriment to economic growth is continued stress in the Financials and Real Estate sectors. These higher rates serve as a ceiling on equity valuations and will likely keep markets in a choppy holding pattern in coming quarters.
Performance Highlights
The Snow Small Cap Value strategy outperformed during the quarter, returning -2.11% gross of fees (-2.28% net of fees), while the Russell 2000 Value index declined -2.96%. Year-to-date, the strategy has returned 8.74% gross of fees (8.17% net of fees) compared to the benchmark returning -0.53%. Over the trailing one-year period, the strategy continues to perform well, outperforming by 1,640 basis points, returning 24.25% gross of fees (23.38% net of fees), while the Russell 2000 Value has gained only 7.84%.
For the quarter, the Snow Small Cap Value strategy’s relative performance was driven by stock selection. Stock selection in Financials, Consumer Discretionary, and Communication Services lead the way, while selection in Information Technology was the largest detractor. From an allocation perspective, being underweight Utilities and Real Estate added value, while our overweight in Information Technology and underweight in Energy detracted.
Source: SEI Global Services as September 30, 2023
Performance shown is the Easterly Investment Partners LLC (“the Firm”) Snow Small Cap Value composite in USD. Past performance is not indicative of future results. Gross performance results do not include advisory fees and other expenses an investor may incur, which when deducted will reduce returns. Changes in exchange rates may have adverse effects. Net performance results reflect the application of a model investment management fee which is higher than the actual average weighted management fee charged to accounts in the composite applied to gross performance results. Actual fees may vary depending on, among other things, the applicable fee schedule and portfolio size. The Firm claims compliance with the GIPS® standards; this information is supplemental to the GIPS® report included in this material. Returns greater than one year are annualized.
Portfolio Attribution
Top 5 Performance Contributors
| Stock | Avg Weight % | Contribution % |
|---|---|---|
| MODINE MANUFACTURING CO | 2.27 | 0.76 |
| DELEK US HOLDINGS INC | 3.74 | 0.62 |
| ZIONS BANCORP NA | 1.88 | 0.44 |
| CINEMARK HOLDINGS INC | 3.38 | 0.35 |
| SUPER MICRO COMPUTER INC | 2.79 | 0.33 |
Modine Manufacturing (MOD)
MOD continues to see strong fundamental improvement, fueled by strength across every business segment. The stock has also seen some improvement to the valuation multiple given its exposure to generative AI through their Data Center cooling business. We continue to hold MOD as the valuation is still conservative given the expected growth in revenue and margins.
Delek (DK)
Shares of DK positively contributed to performance during the quarter driven by resilient refined product demand. DK has announced plans to enhance the reliability of its refineries and has been reviewing the company’s portfolio to unlock value, potentially through a sale of its midstream or retail assets. The company maintains modest leverage, has an active share repurchase, and raised its dividend in the quarter.
Zions Bancorp (ZION)
ZION rallied around the quarterly earnings release as the company announced strong results, with better deposit costs and more favorable net interest margin (NIM). ZION continues to trade at a discount to its intrinsic value with a stabilized NIM and room for improvement as loans continue to reprice.
Top 5 Performance Detractors
| Stock | Avg Weight % | Contribution % |
|---|---|---|
| PHOTRONICS INC | 4.58 | -1.05 |
| SILICON MOTION TECHNOL-ADR | 2.92 | -0.97 |
| AMN HEALTHCARE SERVICES INC | 3.92 | -0.95 |
| BRINKER INTERNATIONAL INC | 3.41 | -0.48 |
| CROSS COUNTRY HEALTHCARE INC | 3.47 | -0.42 |
Photronics (PLAB)
Shares in PLAB moved lower during the quarter along with broad weakness in the Technology space after hitting an all-time high early in Q2. The company has done well to expand margins, grow market share, and maintain pricing power despite some end-market weakness.
Silicon Motion Technology (SIMO)
SIMO detracted during the quarter due in part to MaxLinear (MXL) announcing they would be terminating their acquisition of the company after regulators had approved the proposed transaction. Negative sentiment in the company’s memory end-markets also pushed semiconductor stocks lower.
AMN Healthcare Services (AMN)
Shares of healthcare staffing firms AMN and Cross Country Healthcare (CCRN) detracted from performance as the companies lowered guidance for the second half of the year. Despite healthcare systems reducing spend on contingent labor throughout the year, nurse staffing levels remain tight, and bill rates remain well above pre-pandemic levels. AMN and CCRN have strong balance sheets, active share repurchases, and trade at attractive valuation levels.
Source: SEI Global Services.
Securities shown represent the largest contributors and detractors to the portfolio’s performance for the period and do not represent all holdings within the portfolio. There is no guarantee that such holdings are currently or will remain in the portfolio. For a complete list of holdings and an explanation of the methodology employed to determine this information, please contact Easterly. This information is not to be construed as an offer to buy or sell any financial instrument nor does it constitute an offer or invitation to invest in any fund managed by Easterly and has not been prepared in connection with any such offer.
Trailing Performance
as of September 30, 2023
| QTD | YTD | 1 Yr | 3 Yr | 5 Yr | 7 Yr | 10 Yr | Since Inception* | |
|---|---|---|---|---|---|---|---|---|
| Composite (gross) | -2.11% | 8.74% | 24.25% | 23.18% | 8.04% | 9.78% | 7.32% | 8.91% |
| Composite (net) | -2.28% | 8.17% | 23.38% | 22.34% | 7.29% | 9.02% | 6.58% | 8.15% |
| Russell 2000 Value | -2.96% | -0.53% | 7.84% | 13.32% | 2.59% | 5.94% | 6.19% | 5.53% |
Calendar Year Performance
| 2022 | 2021 | 2020 | 2019 | 2018 | 2017 | 2016 | 2015 | 2014 | 2013 | |
|---|---|---|---|---|---|---|---|---|---|---|
| Composite (gross) | -6.68% | 28.44% | 24.16% | 19.39% | -18.81% | 8.35% | 22.75% | -15.99% | 4.92% | 44.53% |
| Composite (net) | -7.33% | 27.56% | 23.31% | 18.57% | -19.39% | 7.60% | 21.91% | -16.59% | 4.19% | 43.55% |
| Russell 2000 Value | -14.48% | 28.27% | 4.63% | 22.39% | -12.86% | 7.84% | 31.74% | -7.47% | 4.22% | 34.52% |
Source: SEI Global Services
Inception: 10/31/06
Performance shown is the Easterly Investment Partners LLC (“the Firm”) Snow Small Cap Value composite in USD. Past performance is not indicative of future results. Gross performance results do not include advisory fees and other expenses an investor may incur, which when deducted will reduce returns. Changes in exchange rates may have adverse effects. Net performance results reflect the application of a model investment management fee which is higher than the actual average weighted management fee charged to accounts in the composite applied to gross performance results. Actual fees may vary depending on, among other things, the applicable fee schedule and portfolio size. The Firm claims compliance with the GIPS® standards; this information is supplemental to the GIPS® report included in this material. Returns greater than one year are annualized.
Top 10 Holdings
| PHOTRONICS INC | 4.26% |
| DELEK US HOLDINGS INC | 4.10% |
| CINEMARK HOLDINGS INC | 3.86% |
| CNO FINANCIAL GROUP INC | 3.77% |
| AMN HEALTHCARE SERVICES INC | 3.65% |
| CROSS COUNTRY HEALTHCARE INC | 3.55% |
| BLOOMIN' BRANDS INC | 3.47% |
| PILGRIM'S PRIDE CORP | 3.44% |
| SILICON MOTION TECHNOL-ADR | 3.39% |
| COMMERCIAL METALS CO | 3.30% |
| Total | 36.79% |
|---|
Excludes cash and cash equivalents.
References to securities, transactions or holdings should not be considered a recommendation to purchase or sell a particular security and there is no assurance that, as of the date of publication, the securities remain in the portfolio. Additionally, it is noted that the securities or transactions referenced do not represent all of the securities purchased, sold or recommended during the period referenced and there is no guarantee as to the future profitability of the securities identified and discussed herein. Top ten holdings information shown combines share listings from the same issuer, and related depositary receipts, into a singular holding to accurately present aggregate economic interest in the referenced company.
Attribution vs Russell 2000 Value
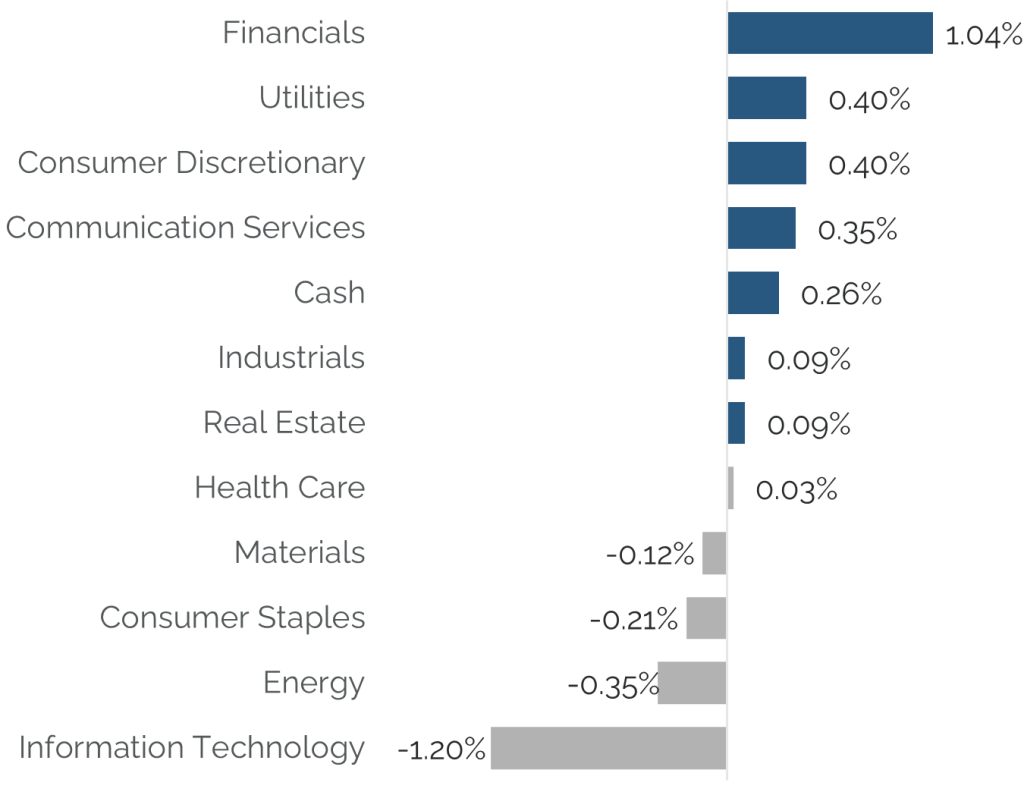
Source: Bloomberg
Holdings, sector weightings, market capitalization and portfolio characteristics are subject to change at any time and are based on a representative portfolio, and may differ, sometimes significantly, from individual client portfolios.
Outlook
In our view, the largest opportunity set is in small cap. As we discussed above, large cap returns have dominated 2023 results, however, we anticipate several tailwinds to fuel small cap investment results relative to large cap in the quarters ahead. Eventual easing of interest rate stress will accrue to benefit small cap companies. Additionally, large caps are trading at a historical P/E premium to small caps, not seen since 2001. Looking at just earnings, the Russell 2000 Value Index trades near its lowest P/E in over 30 years, at 9.7x, compared to its long-term average of 16.1x forward earnings. This is similar to the lows seen during the Financial Crisis and below the lows from both the 2001 recession as well as the COVID sell-off in 2020.
Looking ahead we expect more of the same on the economy—a slow rate of growth. We expect large divergences across companies as they navigate this environment and position themselves to preserve profit margins. Even though we expect the broad markets to return muted results, we continue to find companies with compelling business fundamentals, durable competitive advantages, and recurring revenue streams that are generating strong cash flows to fund future growth. We also favor effective management teams, which have the right balance of strategic vision, financial discipline, and capital allocation skills.
In closing, we remain dedicated to delivering strong long-term performance and transparent communications to our investors. Thank you for your confidence and commitment in Easterly Investment Partners. As always, we welcome your comments and questions.
Easterly Investment Partners LLC Snow Small Cap Value Composite GIPS® Report
Composite Inception Date: October 31, 2006
Composite Creation Date: 07/01/2021
| Year End | Composite Performance | Annualized 3-Year Standard Deviation | Total Assets (millions) | ||||||||
|---|---|---|---|---|---|---|---|---|---|---|---|
| Gross | Net | Russell 3000® Value | Composite | Russell 3000® Value | Composite Dispersion | Total Firm Assets | Firm (AUM) | Firm (AUA)* | Composite | Number of Accounts | |
| 2022 | -6.68% | -7.33% | -14.48% | 33.38% | 27.66% | N/A | 1,834 | 1,341 | 493 | 55 | Five or fewer |
| 2021 | 28.44% | 27.56% | 28.27% | 32.10% | 25.35% | N/A | 2718 | 1540 | 1178 | 77 | Five or fewer |
| 2020 | 24.16% | 23.31% | 4.63% | 32.68% | 26.12% | 0.10% | - | - | 78 | Five or fewer | |
| 2019 | 19.39% | 18.57% | 22.39% | 20.50% | 15.70% | 0.20% | - | - | 82 | Five or fewer | |
| 2018 | -18.81% | -19.39% | -12.86% | 20.10% | 15.80% | N/A | - | - | 103 | Five or fewer | |
| 2017 | 8.35% | 7.60% | 7.84% | 18.20% | 14.00% | N/A | - | - | 421 | 6 | |
| 2016 | 22.75% | 21.91% | 31.74% | 18.40% | 15.50% | 0.60% | - | - | 627 | 10 | |
| 2015 | -15.99% | -16.59% | -7.47% | 15.00% | 13.50% | 0.50% | - | - | 643 | 12 | |
| 2014 | 4.92% | 4.19% | 4.22% | 15.20% | 12.80% | N/A | - | - | 557 | 9 | |
| 2013 | 44.53% | 43.55% | 34.52% | 20.30% | 15.80% | N/A | - | - | 141 | Five or fewer | |
*Firm-wide advisory- only assets. Assets under Advisement (AUA) includes the assets where Easterly Investment Partners (“Easterly”) provides its advisory services in similar strategies and does not have discretionary trading authority.
Firm Definition
For purposes of complying with the GIPS® standards, the firm is defined as Easterly Investment Partners LLC (“EIP”) which is an SEC registered investment adviser under the U.S. Investment Advisers Act of 1940, as amended, effective January 2019. The firm was redefined on 1/1/2023 to reflect that EIP is comprised of two distinct firms: the institutional asset management operations, investment strategies, performance track records, certain employees and client accounts of Levin Capital Strategies, which were acquired by EIP in March 2019, and Snow Capital Management LLC’s (“SCM”) asset management business, investment strategies, performance track records, client accounts, and certain employees, acquired by EIP in July 2021.
Firm Verification Statement
Easterly claims compliance with the Global Investment Performance Standards (GIPS®) and has prepared and presented this report in compliance with the GIPS standards. Easterly has been independently verified for the period April 1, 2019 through December 31, 2022. A firm that claims compliance with the GIPS standards must establish policies and procedures for complying with all the applicable requirements of the GIPS standards. Verification provides assurance on whether the firm’s policies and procedures related to composite and pooled fund maintenance, as well as the calculation, presentation, and distribution of performance, have been designed in compliance with the GIPS standards and have been implemented on a firm-wide basis.
Composite Verification Statement
The Small Cap Value Composite has had a performance examination from composite inception date through December 31, 2022. The verification and performance examination reports are available upon request.
Composite Description
The Small Cap composite provides exposure to long-only US publicly-listed securities and ADRs, and may occasionally invest in convertible and corporate bonds, taking into account various factors. The strategy is biased toward Small capitalization value stocks, and position sizes range between 0.5% to 5%, with liquidity as a consideration.
Benchmark Description
The Russell 2000 Value Index measures the performance of small-cap value segment of the U.S. equity universe. It includes those Russell 2000 companies with lower price-to-book ratios and lower forecasted growth values. Indexes are unmanaged. It is not possible to invest directly in an index.
Performance Calculation
All returns are calculated and presented in US dollars based on fully discretionary AUM, including those investors no longer with the firm. All gross composite returns are net of transaction costs and gross of foreign withholding taxes, if any, and reflect the reinvestment of interest income and other earnings. Net performance results reflect the application of a model investment management fee which is higher than the actual average weighted management fee charged to accounts in the composite applied to gross performance results. Actual fees may vary depending on, among other things, the applicable fee schedule and portfolio size. Actual investment advisory fees incurred by clients will vary. Policies for valuing investments, calculating performance, and preparing GIPS reports are available upon request. A list of composite descriptions is available upon request. Past performance is not indicative of future performance. Results may be higher or lower based on IPO eligibility, and actual investor’s returns may differ, depending upon date(s) of investment(s). Additional information is available upon request.
Investment Management Fee Schedule
The current standard management fee schedule for a segregated account managed to the composite strategy is as follows: 0.70% on the first $25 million; 0.55% on the next $75 million; 0.50% on the next $100 million; 0.45% on the next $100 million; 0.35% on the balance.
Composite Dispersion
The annual composite dispersion, if shown, is an asset-weighted standard deviation calculated using gross returns for the accounts in the composite the entire year. The internal dispersion measure is not applicable if there are five or fewer portfolios in the composite for the entire year if that is the reason this is N/A.
Standard Deviation
The annualized 3-year standard deviation represents the annualized standard deviation of actual gross composite and benchmark returns, using the rolling 36 months ended each year end. Standard deviation is a measurement of historical volatility of investment returns.
Trademark
GIPS® is a registered trademark of CFA Institute. CFA Institute does not endorse or promote this organization, nor does it warrant the accuracy or quality of the content contained herein.
Important Disclosures
© 2023. Easterly Asset Management. All rights reserved.
Easterly Asset Management’s advisory affiliates (collectively, “EAM” or “the Firm”), including Easterly Investment Partners LLC, Easterly Funds LLC, and Easterly EAB Risk Solutions LLC (“Easterly EAB”) are registered with the SEC as investment advisers under the Investment Advisers Act of 1940, as amended. Registration does not imply a certain level of skill or training. More information about the firm, including its investment strategies and objectives, can be found in each affiliate’s Form ADV Part 2 which is available on the www.sec.gov website. This information has been prepared solely for the use of the intended recipients; it may not be reproduced or disseminated, in whole or in part, without the prior written consent of EAM.
No funds or investment services described herein are offered or will be sold in any jurisdiction in which such an offer or sale would be unlawful under the laws of such jurisdiction. No such fund or service is offered or will be sold in any jurisdiction in which registration, licensing, qualification, filing or notification would be required unless such registration, license, qualification, filing, or notification has been effected.
The material contains information regarding the investment approach described herein and is not a complete description of the investment objectives, risks, policies, guidelines or portfolio management and research that supports this investment approach. Any decision to engage the Firm should be based upon a review of the terms of the prospectus, offering documents or investment management agreement, as applicable, and the specific investment objectives, policies and guidelines that apply under the terms of such agreement. There is no guarantee investment objectives will be met. The investment process may change over time. The characteristics set forth are intended as a general illustration of some of the criteria the strategy team considers in selecting securities for client portfolios. Client portfolios are managed according to mutually agreed upon investment guidelines. No investment strategy or risk management techniques can guarantee returns or eliminate risk in any market environment. All information in this communication has been obtained from sources believed to be reliable but cannot be guaranteed. Investment products are not FDIC insured and may lose value.
Investments are subject to market risk, including the loss of principal. Nothing in this material constitutes investment, legal, accounting or tax advice, or a representation that any investment or strategy is suitable or appropriate. The information contained herein does not consider any investor’s investment objectives, particular needs, or financial situation and the investment strategies described may not be suitable for all investors. Individual investment decisions should be discussed with a personal financial advisor.
Any opinions, projections and estimates constitute the judgment of the portfolio managers as of the date of this material, may not align with the Firm’s opinion or trading strategies, and may differ from other research analysts’ opinions and investment outlook. The information herein is subject to change without notice and may be superseded by subsequent market events or for other reasons. EAM assumes no obligation to update the information herein.
References to securities, transactions or holdings should not be considered a recommendation to purchase or sell a particular security and there is no assurance that, as of the date of publication, the securities remain in the portfolio. Additionally, it is noted that the securities or transactions referenced do not represent all of the securities purchased, sold or recommended during the period referenced and there is no guarantee as to the future profitability of the securities identified and discussed herein. As a reminder, investment return and principal value will fluctuate.
The indices cited are, generally, widely accepted benchmarks for investment performance within their relevant regions, sectors or asset classes, and represent non managed investment portfolio. It is not possible to invest directly in an index.
This communication may contain forward-looking statements, which reflect the views of EAM and/or its affiliates. These forward-looking statements can be identified by reference to words such as “believe”, “expect”, “potential”, “continue”, “may”, “will”, “should”, “seek”, “approximately”, “predict”, “intend”, “plan”, “estimate”, “anticipate” or other comparable words. These forward-looking statements or other predications or assumptions are subject to various risks, uncertainties, and assumptions. Accordingly, there are or will be important factors that could cause actual outcomes or results to differ materially from those indicated in these statements. Should any assumptions underlying the forward-looking statements contained herein prove to be incorrect, the actual outcome or results may differ materially from outcomes or results projected in these statements. EAM does not undertake any obligation to update or review any forward-looking statement, whether as a result of new information, future developments or otherwise, except as required by applicable law or regulation.
Past performance is no guarantee of future results.
231020-3178410