Market Summary
Major market indices increased in the quarter, led by strong returns in the Technology sector, specifically centered around Artificial Intelligence (AI). Across the market cap spectrum and for the second quarter in a row, Growth indices outpaced Value while Large Cap indices outpaced Small Cap. The market advance came amid moderating inflation and signs that the US economy remains resilient despite higher interest rates. Similar themes from the first quarter carried into the second quarter, with the S&P 500 index finishing the first half of the year up 16.89%.
The drivers of performance diverged significantly, with the market breadth exceptionally narrow. Taking a deeper look into the S&P 500 Index, as a proxy for the broad market, seven stocks accounted for the majority of the period’s results; Tesla (TSLA), Microsoft (MSFT), Alphabet (GOOGL), Meta (META), Apple (AAPL), Amazon (AMZN), and Nvidia (NVDA). Excluding these seven, the rest of the market was up in the low single digits. In our view, sustaining that rally will be tough as the market’s focus will shift to identifying the longer-term AI winners with tangible supporting evidence.
Excitement around AI and the potential for a boom in automation as well as elevated levels of efficiency fueled investors’ appetite for companies positioned to benefit from the usage of data analytics and robotics. Recent break-throughs in generative AI were brought into the public sphere by OpenAI’s ChatGPT, including a wave of investor curiosity.
These seemingly new capabilities attract investors and business operators alike. With open access to emerging technology, anyone with an interest and access to the internet can quickly experiment with how organizations and individuals may better drive productivity and expand profit margins.
Performance Highlights
The Snow Focused Value strategy outperformed the benchmark by 249 basis points during the quarter, returning 6.56% gross of fees (6.31% net of fees), while the Russell 1000 Value index gained 4.07%. The strategy has now outperformed the benchmark by 777 basis points over the prior one-year period, returning 19.31% gross of fees (18.19% net of fees), while the Russell 1000 Value gained 11.54%.1
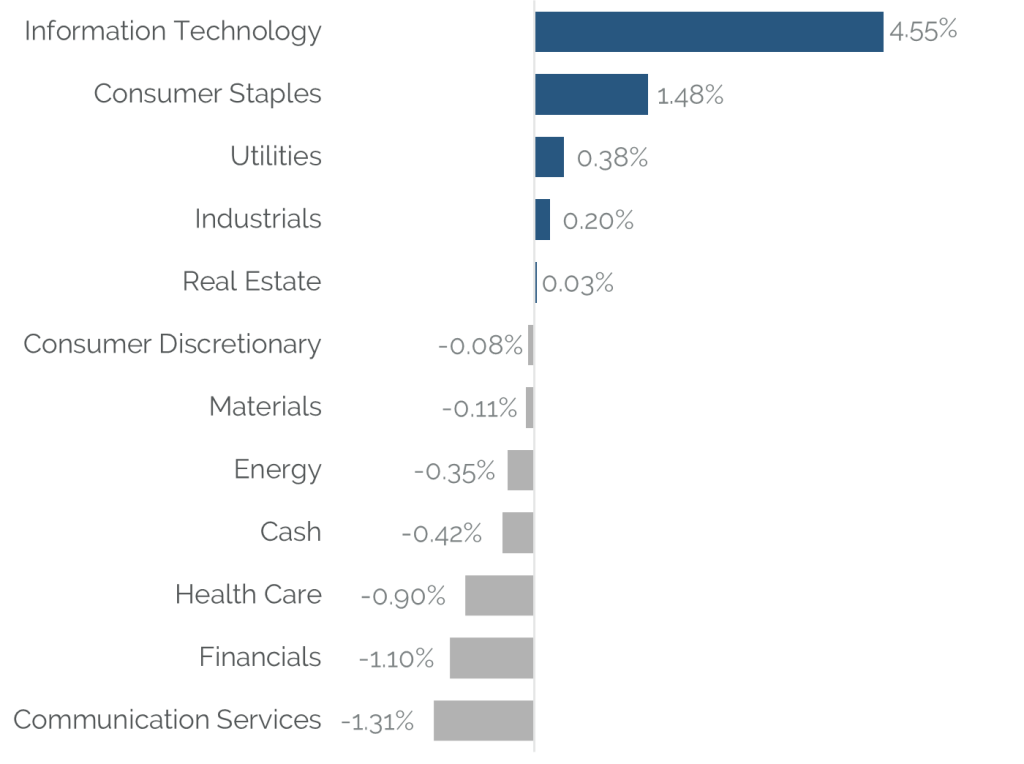
For the quarter, our Snow Focused Value strategy’s relative performance was driven entirely by stock selection, as sector positioning detracted from performance. Stock selection was strong in Information Technology and Consumer Staples while Financials, Communication Services, and Health Care were the largest detractors. From an allocation perspective, our underweight position in both Industrials and Communication Services were the largest detractors. An underweight position in Utilities and an overweight to Consumer Discretionary contributed to relative performance.
Source: SEI Global Services as June 30, 2023
1Performance shown is the Easterly Investment Partners LLC (“the Firm”) Snow Small Cap Value composite in USD. Past performance is not indicative of future results. Gross performance results do not include advisory fees and other expenses an investor may incur, which when deducted will reduce returns. Changes in exchange rates may have adverse effects. Net performance results reflect the application of a model investment management fee which is higher than the actual average weighted management fee charged to accounts in the composite applied to gross performance results. Actual fees may vary depending on, among other things, the applicable fee schedule and portfolio size. The Firm claims compliance with the GIPS® standards; this information is supplemental to the GIPS® report included in this material. Returns greater than one year are annualized.
Portfolio Attribution
Top 5 Performance Contributors
| Stock | Avg Weight % | Contribution% |
|---|---|---|
| Super Micro Computer | 4.38 | 4.09 |
| Molson Coors Beverage | 4.58 | 1.35 |
| WESCO International | 5.06 | 0.93 |
| Hasbro | 4.28 | 0.87 |
| Advanced Micro Devices | 4.46 | 0.84 |
Top 5 Performance Detractors
| Stock | Avg Weight % | Contribution% |
|---|---|---|
| AbbVie | 4.3 | -0.73 |
| Comerica | 2.2 | -0.64 |
| Walt Disney | 4.5 | -0.54 |
| Integra LifeSciences Holding | 1.34 | -0.44 |
| Regions Financial | 1.08 | -0.34 |
Super Micro Computer (SMCI)
Shares of SMCI surged during the quarter as investors flocked to potential beneficiaries of AI. While AI is a large opportunity for SMCI (approximately a third of revenues in the most recent quarter), the company has been gaining share across several end markets, driving revenue growth and margin expansion in recent years. SMCI has longstanding partnerships with companies believed to be large winners from the boom in AI and they forecast robust growth for their AI infrastructure as CPU and GPU usage rise. SMCI is well-positioned for significant earnings growth, has a modest net cash position, and recently resumed a share repurchase. The next major catalyst is an update to FY’24 guidance.
Molson Coors Beverage (TAP)
Shares of TAP contributed to overall performance during the quarter as the company was the primary beneficiary of a controversial marketing campaign by their largest competitor. TAP has continued to execute well since we initiated a position, with Q2 marking the 9th consecutive quarter of positive underlying revenue growth. Shares continue to trade at a reasonable earnings multiple despite the recent outperformance. We expect an updated capital allocation plan in the near term as leverage has declined to target levels.
WESCO International (WCC)
WCC shares appreciated as the company reported healthy sales and backlog growth. Following a period of accretive M&A, WCC has successfully reached its leverage target and is shifting more capital towards shareholder return, including buybacks and a dividend. Shares remain attractively valued, trading for 11x forward earnings estimates.
AbbVie (ABBV)
ABBV detracted from overall performance as competitors launched biosimilars against blockbuster immunology therapy, Humira. Weak share performance can also be attributed to longer-term concerns around pharmaceuticals pricing, as the Inflation Reduction Act looks to allow Medicare drug price negotiations. Despite the near-term concerns around Humira competition, ABBV continues to execute operationally and raised their 2023 earnings outlook. We feel that as ABBV continues to execute their Humira life-cycle management plans, investors will begin to appreciate ABBV’s diverse portfolio of therapies, which will allow for company’s 6-7% topline/low double digit bottom-line growth profile.
Comerica (CMA)
Comerica Inc. (CMA) pulled back on wider weakness in the regional banking space where correlations were elevated. The portfolio sold the position following a report that the company had violated the US Treasury’s Direct Express program, where the potential liability could be material. Given the limited number of names we hold in the Focused Value product, capital was reallocated into ideas with less overhangs.
Walt Disney (DIS)
DIS pulled back during the quarter as investors continue to question when outsized spending supporting the company’s direct-to-consumer efforts will moderate. While the company’s Parks business has been doing great, expecting those results in perpetuity seems unlikely and investors are re-focusing on what supports normalized bottom-line earnings figures.
Source: SEI Global Services.
Securities shown represent the highest contributors and detractors to the portfolio’s performance for the period and do not represent all holdings within the portfolio. There is no guarantee that such holdings currently or will remain in the portfolio. For a complete list of holdings and an explanation of the methodology employed to determine this information, please contact Easterly. This information is not to be construed as an offer to buy or sell any financial instrument nor does it constitute an offer or invitation to invest in any fund managed by Easterly and has not been prepared in connection with any such offer.
Trailing Performance
as of June 30, 2023
| QTD | YTD | 1 Year | 3 Year | 5 Year | 7 Year | 10 Year | SI* | |
|---|---|---|---|---|---|---|---|---|
| Composite (Gross) | 6.56% | 7.75% | 19.31% | 22.10% | 9.44% | 11.31% | 9.07% | 14.01% |
| Composite (Net) | 6.31% | 7.24% | 18.19% | 20.96% | 8.41% | 10.27% | 8.05% | 12.94% |
| Russell 1000 Value | 4.07% | 5.12% | 11.54% | 14.30% | 8.10% | 8.94% | 9.21% | 11.17% |
Calendar Year Performance
| 2022 | 2021 | 2020 | 2019 | 2018 | 2017 | 2016 | 2015 | 2014 | 2013 | |
|---|---|---|---|---|---|---|---|---|---|---|
| Composite (Gross) | -1.11% | 31.80% | 2.56% | 28.00% | -18.03% | 17.76% | 15.10% | -18.20% | 15.17% | 50.18% |
| Composite (Net) | -2.04% | 30.57% | 1.59% | 26.81% | -18.81% | 16.66% | 14.03% | -18.99% | 14.10% | 48.81% |
| Russell 1000 Value | -7.54% | 25.16% | 2.80% | 26.54% | -8.27% | 13.66% | 17.34% | -3.83% | 13.45% | 32.53% |
Source: SEI Global Services
*Inception: 12/31/08
Performance shown is the Easterly Investment Partners LLC (“the Firm”) Snow Focused Value composite in USD. Past performance is not indicative of future results. Gross performance results do not include advisory fees and other expenses an investor may incur, which when deducted will reduce returns. Changes in exchange rates may have adverse effects. Net performance results reflect the application of a model investment management fee which is higher than the actual average weighted management fee charged to accounts in the composite applied to gross performance results. Actual fees may vary depending on, among other things, the applicable fee schedule and portfolio size. The Firm claims compliance with the GIPS® standards; this information is supplemental to the GIPS® report included in this material. Returns greater than one year are annualized.
Top 10 Holdings
| WESCO International Inc | 6.12% |
|---|---|
| JPMorgan Chase & Co | 5.30% |
| Centene Corp | 4.87% |
| Hasbro Inc | 4.85% |
| PVH Corp | 4.82% |
| Zimmer Biomet Holdings Inc | 4.80% |
| Sanofi-ADR | 4.40% |
| Freeport-McMoran Inc | 4.01% |
| Walt Disney Co | 3.99% |
| Hartford Financial Services | 3.88% |
| Total | 47.04% |
References to securities, transactions or holdings should not be considered a recommendation to purchase or sell a particular security and there is no assurance that, as of the date of publication, the securities remain in the portfolio. Additionally, it is noted that the securities or transactions referenced do not represent all of the securities purchased, sold or recommended during the period referenced and there is no guarantee as to the future profitability of the securities identified and discussed herein. Top ten holdings information shown combines share listings from the same issuer, and related depositary receipts, into a singular holding to accurately present aggregate economic interest in the referenced company.
Excludes cash and cash equivalents.
Attribution vs Russell 1000 Value
Source: Bloomberg
Holdings, sector weightings, market capitalization and portfolio characteristics are subject to change at any time and are based on a representative portfolio, and may differ, sometimes significantly, from individual client portfolios.
Outlook
Looking ahead, we expect slow economic growth to weigh on demand. Many signs point to slowing growth. The yield curve remains inverted and Institute for Supply Management (ISM) indicators report declining levels.
For the past year, inflation has challenged central banks and weighed heavily on investors. With the Federal Reserve Bank (Fed) bringing about its sharpest tightening of monetary policy in decades, inflation is cooling slightly. In turn, we believe there will be an additional 25 to 50 basis point increase in the Fed Funds Rate over the remainder of the year until inflation is closer to the Fed target of 2.0%.
In our view, given the array of macroeconomic headwinds, the direction of equity prices will be more modest and driven by companies with favorable valuations and solid fundamentals. The environment is complex and paired with sectors experiencing different phases of the economic cycle, security selection is incredibly valuable. Our strategy is performing well due to the consistent application of our investment approach.
As such, we continue to hold companies with compelling business fundamentals, durable competitive advantages, and recurring revenue streams that are generating strong cash flows to fund future growth. We also favor effective management teams, which have the right balance of strategic vision, financial discipline, and capital allocation skills.
Taken together, we believe that we are invested in a collection of companies with above average earnings potential, driven by margin expansion and the shareholder friendly deployment of free cash flow. The portfolio is valued at just 9.84 x earnings while providing a free cash yield of 11.06% with a large portion of that free cash flow being paid out as dividends.
We remain dedicated to delivering strong long-term performance and transparent communications to our investors. As always, we welcome your comments and questions. Thank you for your commitment to Easterly Investment Partners.
Easterly Investment Partners LLC Snow Focused Value Composite GIPS® Report
Composite Inception Date: December 31, 2008
Composite Creation Date: July 1, 2021
| Year | Composite Performance | Annualized 3-Year Standard Deviation | Total Asset (millions) | Number of Accounts | |||||||
|---|---|---|---|---|---|---|---|---|---|---|---|
| End | Gross | Net | Russell 1000® Value | Composite | Russell 1000® Value | Composite Dispersion | Total Firm Assets | Firm (AUM) | Firm (AUA)* | Composite | |
| 2022 | -1.11% | -2.04% | -7.54% | 25.73% | 21.55% | N/A | 1,834 | 1,341 | 493 | 1 | Five or fewer |
| 2021 | 31.80% | 30.57% | 25.16% | 24.28% | 19.33% | N/A | 2,718 | 1,540 | 1,178 | 30 | Five or fewer |
| 2020 | 2.56% | 1.59% | 2.80% | 24.63% | 19.62% | 0.10% | - | - | 26 | 10 | |
| 2019 | 28.00% | 26.81% | 26.54% | 14.90% | 11.90% | 0.14% | - | - | 31 | 9 | |
| 2018 | -18.03% | -18.81% | -8.27% | 15.30% | 10.80% | 0.05% | - | - | 3.4 | 8 | |
| 2017 | 17.76% | 16.66% | 13.66% | 16.65% | 10.20% | 0.06% | - | - | 5 | 8 | |
| 2016 | 15.10% | 14.03% | 17.34% | 17.07% | 10.77% | N/A | - | - | 25 | 6 | |
| 2015 | -18.20% | -18.99% | -3.83% | 15.63% | 10.68% | N/A | - | - | 26 | 7 | |
| 2014 | 15.17% | 14.10% | 13.45% | 13.98% | 9.20% | N/A | - | - | 37 | Five or Fewer | |
| 2013 | 50.18% | 48.81% | 32.53% | 19.22% | 12.70% | N/A | - | - | 1 | Five or fewer | |
Firm-wide advisory- only assets. Assets under Advisement (AUA) includes the assets where Easterly Investment Partners (“Easterly”) provides its advisory services in similar strategies and does not have discretionary trading authority.
Firm Definition
For purposes of complying with the GIPS® standards, the firm is defined as Easterly Investment Partners LLC (“EIP”) which is an SEC registered investment adviser under the U.S. Investment Advisers Act of 1940, as amended, effective January 2019. The firm was redefined on 1/1/2023 to reflect that EIP is comprised of two distinct firms: the institutional asset management operations, investment strategies, performance track records, certain employees and client accounts of Levin Capital Strategies, which were acquired by EIP in March 2019, and Snow Capital Management LLC’s (“SCM”) asset management business, investment strategies, performance track records, client accounts, and certain employees, acquired by EIP in July 2021.
Firm Verification Statement
Easterly claims compliance with the Global Investment Performance Standards (GIPS®) and has prepared and presented this report in compliance with the GIPS standards. Easterly has been independently verified for the period April 1, 2019 through December 31, 2022. A firm that claims compliance with the GIPS standards must establish policies and procedures for complying with all the applicable requirements of the GIPS standards. Verification provides assurance on whether the firm’s policies and procedures related to composite and pooled fund maintenance, as well as the calculation, presentation, and distribution of performance, have been designed in compliance with the GIPS standards and have been implemented on a firm-wide basis.
Composite Verification Statement
The Snow Focused Value Composite has had a performance examination from composite inception date through December 31, 2022. The verification and performance examination reports are available upon request.
Composite Description
The Snow Focused Value composite provides concentrated exposure to the mid- and large-capitalization segments of the value equity market.
Benchmark Description
The Russell 1000® Value Total Return Index measures the performance of the large-cap value segment of the U.S. equity universe. It includes those Russell 1000® Index companies with lower price-to-book ratios and lower expected growth values. The total return index is the price level index plus the dividend reinvested. Indexes are unmanaged. It is not possible to invest directly in an index.
Performance Calculation
All returns are calculated and presented in US dollars based on fully discretionary AUM, including those investors no longer with the firm. All gross composite returns are net of transaction costs and gross of foreign withholding taxes, if any, and reflect the reinvestment of interest income and other earnings. Net performance results reflect the application of a model investment management fee which is higher than the actual average weighted management fee charged to accounts in the composite applied to gross performance results. Actual fees may vary depending on, among other things, the applicable fee schedule and portfolio size. Actual investment advisory fees incurred by clients will vary. Policies for valuing investments, calculating performance, and preparing GIPS reports are available upon request. A list of composite descriptions is available upon request. Past performance is not indicative of future performance. Results may be higher or lower based on IPO eligibility, and actual investor’s returns may differ, depending upon date(s) of investment(s). Additional information is available upon request.
Investment Management Fee Schedule
The current standard management fee schedule for a segregated account managed to the composite strategy is as follows: 0.95% on assets.
Composite Dispersion
The annual composite dispersion, if shown, is an asset-weighted standard deviation calculated using gross returns for the accounts in the composite the entire year. The internal dispersion measure is not applicable if there are five or fewer portfolios in the composite for the entire year if that is the reason this is N/A.
Standard Deviation
The annualized 3-year standard deviation represents the annualized standard deviation of actual gross composite and benchmark returns, using the rolling 36 months ended each year end. Standard deviation is a measurement of historical volatility of investment returns.
Trademark
GIPS® is a registered trademark of CFA Institute. CFA Institute does not endorse or promote this organization, nor does it warrant the accuracy or quality of the content contained herein.
Important Disclosures
© 2023. Easterly Asset Management. All rights reserved.
Easterly Asset Management’s advisory affiliates (collectively, “EAM” or “the Firm”), including Easterly Investment Partners LLC, Easterly Funds LLC, and Easterly EAB Risk Solutions LLC (“Easterly EAB”) are registered with the SEC as investment advisers under the Investment Advisers Act of 1940, as amended. Registration does not imply a certain level of skill or training. More information about the firm, including its investment strategies and objectives, can be found in each affiliate’s Form ADV Part 2 which is available on the www.sec.gov website. This information has been prepared solely for the use of the intended recipients; it may not be reproduced or disseminated, in whole or in part, without the prior written consent of EAM.
No funds or investment services described herein are offered or will be sold in any jurisdiction in which such an offer or sale would be unlawful under the laws of such jurisdiction. No such fund or service is offered or will be sold in any jurisdiction in which registration, licensing, qualification, filing or notification would be required unless such registration, license, qualification, filing, or notification has been effected.
The material contains information regarding the investment approach described herein and is not a complete description of the investment objectives, risks, policies, guidelines or portfolio management and research that supports this investment approach. Any decision to engage the Firm should be based upon a review of the terms of the prospectus, offering documents or investment management agreement, as applicable, and the specific investment objectives, policies and guidelines that apply under the terms of such agreement. There is no guarantee investment objectives will be met. The investment process may change over time. The characteristics set forth are intended as a general illustration of some of the criteria the strategy team considers in selecting securities for client portfolios. Client portfolios are managed according to mutually agreed upon investment guidelines. No investment strategy or risk management techniques can guarantee returns or eliminate risk in any market environment. All information in this communication has been obtained from sources believed to be reliable but cannot be guaranteed. Investment products are not FDIC insured and may lose value.
Investments are subject to market risk, including the loss of principal. Nothing in this material constitutes investment, legal, accounting or tax advice, or a representation that any investment or strategy is suitable or appropriate. The information contained herein does not consider any investor’s investment objectives, particular needs, or financial situation and the investment strategies described may not be suitable for all investors. Individual investment decisions should be discussed with a personal financial advisor.
Any opinions, projections and estimates constitute the judgment of the portfolio managers as of the date of this material, may not align with the Firm’s opinion or trading strategies, and may differ from other research analysts’ opinions and investment outlook. The information herein is subject to change without notice and may be superseded by subsequent market events or for other reasons. EAM assumes no obligation to update the information herein.
References to securities, transactions or holdings should not be considered a recommendation to purchase or sell a particular security and there is no assurance that, as of the date of publication, the securities remain in the portfolio. Additionally, it is noted that the securities or transactions referenced do not represent all of the securities purchased, sold or recommended during the period referenced and there is no guarantee as to the future profitability of the securities identified and discussed herein. As a reminder, investment return and principal value will fluctuate.
The indices cited are, generally, widely accepted benchmarks for investment performance within their relevant regions, sectors or asset classes, and represent non managed investment portfolio. It is not possible to invest directly in an index.
This communication may contain forward-looking statements, which reflect the views of EAM and/or its affiliates. These forward-looking statements can be identified by reference to words such as “believe”, “expect”, “potential”, “continue”, “may”, “will”, “should”, “seek”, “approximately”, “predict”, “intend”, “plan”, “estimate”, “anticipate” or other comparable words. These forward-looking statements or other predications or assumptions are subject to various risks, uncertainties, and assumptions. Accordingly, there are or will be important factors that could cause actual outcomes or results to differ materially from those indicated in these statements. Should any assumptions underlying the forward-looking statements contained herein prove to be incorrect, the actual outcome or results may differ materially from outcomes or results projected in these statements. EAM does not undertake any obligation to update or review any forward-looking statement, whether as a result of new information, future developments or otherwise, except as required by applicable law or regulation.
Past performance is no guarantee of future results.