Market Summary
Major market indices increased in the quarter, led by strong returns in the Technology sector, specifically centered around Artificial Intelligence (AI). Across the market cap spectrum and for the second quarter in a row, Growth indices outpaced Value while Large Cap indices outpaced Small Cap. The market advance came amid moderating inflation and signs that the US economy remains resilient despite higher interest rates. Similar themes from the first quarter carried into the second quarter, with the S&P 500 index finishing the first half of the year up 16.89%.
The drivers of performance diverged significantly, with the market breadth exceptionally narrow. Taking a deeper look into the S&P 500 Index, as a proxy for the broad market, seven stocks accounted for the majority of the period’s results; Tesla (TSLA), Microsoft (MSFT), Alphabet (GOOGL), Meta (META), Apple (AAPL), Amazon (AMZN), and Nvidia (NVDA). Excluding these seven, the rest of the market was up in the low single digits. In our view, sustaining that rally will be tough as the market’s focus will shift to identifying the longer-term AI winners with tangible supporting evidence.
Excitement around AI and the potential for a boom in automation as well as elevated levels of efficiency fueled investors’ appetite for companies positioned to benefit from the usage of data analytics and robotics. Recent break-throughs in generative AI were brought into the public sphere by OpenAI’s ChatGPT, including a wave of investor curiosity.
These seemingly new capabilities attract investors and business operators alike. With open access to emerging technology, anyone with an interest and access to the internet can quickly experiment with how organizations and individuals may better drive productivity and expand profit margins.
Performance Highlights
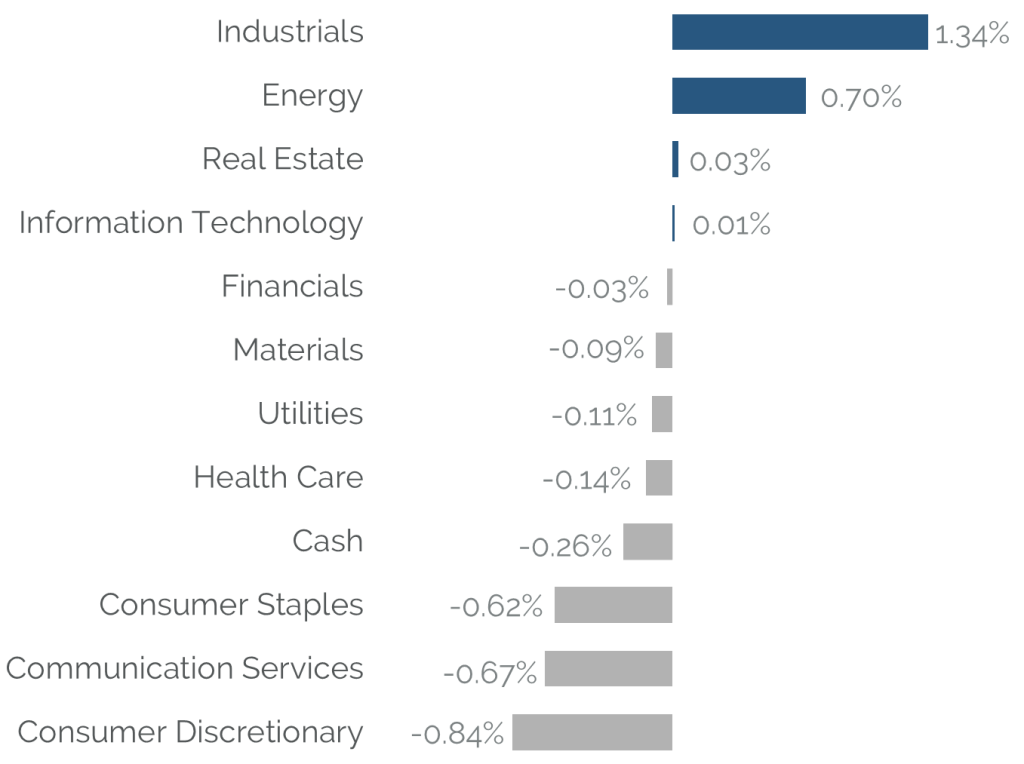
The All Cap Value trailed the benchmark for the quarter, returning 3.17% gross of fees (3.08% net of fees), while the Russell 3000 Value index gained 4.03%. The strategy’s relative under performance was driven entirely by sector positioning, as stock selection added value. The portfolio’s underweight position in Industrials and overweight in Consumer Staples detracted from performance, while its underweight in Utilities added value. From a stock selection standpoint, the portfolio benefitted from strong stock selection in Industrials and Energy. Selection in Consumer Discretionary and Communication Services was weak, with those being the two largest detractors from relative performance.1
Portfolio Attribution
Top 5 Performance Contributors
| Stock | Avg Weight % | Contribution% |
|---|---|---|
| Vertiv Holdings | 1.35 | 1.02 |
| nVent Electric | 3.19 | 0.67 |
| American International Group | 3.88 | 0.57 |
| Lennox International | 1.25 | 0.39 |
| Taiwan Semiconductor-SP | 3.77 | 0.36 |
Vertiv Holdings (VRT)
Shares of VRT gained after the company reported better than expected earnings and proved that new management could deliver on its financial commitments. Throughout the quarter, lead times continued to collapse, which benefits backlog conversion and pricing. The more recent multiple expansion is driven by growth in data center capacity requirements and AI related investments. We believe VRT will continue to outperform due to accelerated data center capex in the back half of the year, continued margin execution, and decreased lead times.
nVent Electric (NVT)
NVT shares added value as the stock benefited from momentum in the sector. The company provides solutions to cool data centers and benefited from the AI tailwind, along with the electrification of everything. NVT also continues to do accretive tuck in M&A, which we believe is the best use of capital allocation. The stock trades about 5x cheaper than its peers despite the strong move in the share price.
American International Group (AIG)
AIG shares promptly sold off 20% during the Regional Bank Crisis in March. While AIG has little exposure to this, the market worried that its internal timeframe to sell down its CRBG stake would be extended due to the weakness in CRBG’s stock. Since then, AIG has rallied back to near pre-crisis level with CRBG following a similar trajectory. Several notable events took place during Q2. AIG announced another secondary sale of CRBG shares in June which reduced their stake to 66% from 77%. We expect offerings to continue with the proceeds going towards share buybacks. AIG also sold its Validus Re segment to RenaissanceRe (RNR) for $3 billion in cash and stock. This move, along with the move to deconsolidate CRBG, continues to transform AIG into a pure play P&C company, which should warrant a higher earnings multiple. Lastly, Q2 financial results were strong when reported in May.
Top 5 Performance Detractors
| Stock | Avg Weight % | Contribution % |
|---|---|---|
| Bio-Rad Laboratories | 3.09 | -0.69 |
| Primo Water | 3.14 | -0.64 |
| Foot Locker | 1.49 | -0.41 |
| Dominion Energy | 4.73 | -0.33 |
| Truist Financial | 2.74 | -0.26 |
Bio-Rad Laboratories (BIO)
BIO shares detracted during the quarter as the company is up against tough post-COVID revenue comparisons. The collapse of Silicon Valley Bank not only impacted tech startups, but it was also the facilitator of funding for life science tools companies, which are the core customer base of BIO. This has created an air pocket which we think will take a few quarters to burn through. We believe the valuation case remains very compelling and we see BIO as growing 5% or more with margin opportunity to 30%.
Primo Water (PRMW)
PRMW shares declined during the quarter. An activist, Legion Partners, ran a proxy contest which ended with two seats on the board as well as a management change, as CEO Tom Harrington will retire at the end of the year. In addition, many of the factors that makes PRMW attractive to investors, such as low volatility, quality, dividends, value, and ESG, were out of favor. From a fundamental standpoint, PRMW remains inexpensive with 135% net income conversion, converting $1.00 of 2024 EPS into $1.35 of FCF and the stock trades at less than 10x FCF.
Foot Locker (FL)
In late March, FL reported strong Q4 financial results with sales, gross margin and EPS beating across the board. Concurrent with the release, FL held an Investor Day where new CEO Mary Dillon noted that 2023 would be a “Reset Year” and that the company would continue to simplify is business model. The company announced medium-term and long-term targets for sales growth, margin and EPS growth, which suggested ~$7/share, valuing the stock at <6x EPS. Fast forward to their Q1 earnings report in May and softer-than-expected sales trends materialized in April and continued into May. Current year EPS guidance was lowered by 40% and the stock followed a similar trajectory. This year will be a bigger reset than originally expected and the timing of medium-term targets likely need to be walked back. We remain fans of the new CEO and believe there is plenty to do to make the business more profitable.
Source: SEI Global Services.
Securities shown represent the highest contributors and detractors to the portfolio’s performance for the period and do not represent all holdings within the portfolio. There is no guarantee that such holdings currently or will remain in the portfolio. For a complete list of holdings and an explanation of the methodology employed to determine this information, please contact Easterly. This information is not to be construed as an offer to buy or sell any financial instrument nor does it constitute an offer or invitation to invest in any fund managed by Easterly and has not been prepared in connection with any such offer.
Trailing Performance
as of June 30, 2023
| QTD | YTD | 1 Year | 3 Year | 5 Year | 7 Year | 10 Year | Since Inception** | |
|---|---|---|---|---|---|---|---|---|
| Composite (Gross) | 3.17% | 3.46% | 7.26% | 15.16% | 5.17% | 8.78% | 10.76% | 12.67% |
| Composite (Net) | 3.08% | 3.24% | 6.77% | 14.59% | 4.66% | 8.24% | 10.21% | 12.11% |
| Russell 3000 Value | 4.03% | 4.98% | 11.22% | 14.38% | 7.78% | 8.87% | 9.08% | 10.78% |
Calendar Year Performance
| 2022 | 2021 | 2020 | 2019 | 2018 | 2017 | 2016 | 2015 | 2014 | 2013 | |
|---|---|---|---|---|---|---|---|---|---|---|
| Composite (Gross) | -6.94% | 24.69% | 7.68% | 12.50% | -5.21% | 17.53% | 23.07% | 3.67% | 9.03% | 47.65% |
| Composite (Net) | -7.41% | 24.07% | 7.13% | 11.94% | -5.69% | 16.95% | 22.46% | 3.16% | 8.49% | 46.94% |
| Russell 3000 Value | -7.98% | 25.37% | 2.87% | 26.26% | -8.58% | 13.19% | 18.40% | -4.13% | 12.70% | 32.69% |
Source: SEI Global Services
*Inception: 12/20/2011
**Returns for periods greater than a year are annualized. Past performance is not indicative of future results.
Performance shown is the Easterly Investment Partners LLC (“the Firm”) All Cap Value composite in USD. Past performance is not indicative of future results. Gross performance results do not include advisory fees and other expenses an investor may incur, which when deducted will reduce returns. Changes in exchange rates may have adverse effects. Net performance results reflect the application of a model investment management fee which is higher than the actual average weighted management fee charged to accounts in the composite applied to gross performance results. Actual fees may vary depending on, among other things, the applicable fee schedule and portfolio size. The Firm claims compliance with the GIPS® standards; this information is supplemental to the GIPS® report included in this material. Returns greater than one year are annualized.
TOP 10 HOLDINGS
| Viatris | 5.96% |
|---|---|
| Verizon Communications | 5.28% |
| Goldman Sachs Group | 4.52% |
| Cisco Systems | 4.40% |
| Walmart | 4.14% |
| Pioneer Natural Resources | 4.07% |
| Taiwan Semiconductor | 4.00% |
| American International Group | 3.93% |
| Dupont De Nemours | 3.91% |
| Dominion Energy | 3.73% |
| Total | 43.94% |
References to securities, transactions or holdings should not be considered a recommendation to purchase or sell a particular security and there is no assurance that, as of the date of publication, the securities remain in the portfolio. Additionally, it is noted that the securities or transactions referenced do not represent all of the securities purchased, sold or recommended during the period referenced and there is no guarantee as to the future profitability of the securities identified and discussed herein. Top ten holdings information shown combines share listings from the same issuer, and related depositary receipts, into a singular holding to accurately present aggregate economic interest in the referenced company.
Total Effect Attribution vs Russell 3000 Value
Representative portfolio characteristics — Holdings, sector weightings, market capitalization and portfolio characteristics are subject to change at any time and are based on a representative portfolio, and may differ, sometimes significantly, from individual client portfolios. Top ten holdings information shown combines share listings from the same issuer, and related depositary receipts, into a singular holding to accurately present aggregate economic interest in the Representative portfolio characteristics — Holdings, sector weightings, market capitalization and portfolio characteristics are subject to change at any time and are based on a representative portfolio, and may differ, sometimes significantly, from individual client portfolios.
Outlook
Looking ahead, we expect slow economic growth to weigh on demand. Many signs point to an impending recession with economic reports indicating slowing growth measures. The yield curve is steeply inverted and Institute for Supply Management (ISM) indicators report declining levels.
For the past year, high inflation has challenged central banks and weighed heavily on investors. With the Federal Reserve Bank (Fed) bringing about its sharpest tightening of monetary policy in decades, inflation is cooling slightly. In turn, we believe there will be an additional 25 to 50 basis point increase in the Fed Funds Rate over the remainder of the year until inflation is closer to the Fed target of 2.0%.
In our view, given the array of macroeconomic headwinds, the direction of equity prices will be more modest and driven by companies with favorable valuations and solid fundamentals. The environment is complex and paired with sectors experiencing different phases of the economic cycle, security selection is incredibly valuable. Our strategy is performing well due to the consistent application of our investment approach.
As such, we continue to hold companies with compelling business fundamentals, durable competitive advantages, and recurring revenue streams that are generating strong cash flows to fund future growth. We also favor effective management teams, which have the right balance of strategic vision, financial discipline, and capital allocation skills.
Taken together, we believe that we are invested in a collection of companies with above average earnings potential and the shareholder friendly deployment of free cash flow. The portfolio is valued at just 10.99x earnings while providing a free cash yield of 7.68% with a large portion of that free cash flow being paid out as dividends.
We remain dedicated to delivering strong long-term performance and transparent communications to our investors. As always, we welcome your comments and questions. Thank you for your commitment to Easterly Investment Partners.
Easterly Investment Partners LLC All Cap Value Composite GIPS® Report
Composite Inception Date: December 20, 2011
Composite Creation Date: April 1, 2019
| Year | Composite Performance | Annualized 3-Year Standard Deviation | Total Asset (millions) | Number of Accounts | |||||||
|---|---|---|---|---|---|---|---|---|---|---|---|
| End | Gross | Net | Russell 3000® Value | Composite | Russell 3000® Value | Composite Dispersion | Total Firm Assets | Firm (AUM) | Firm (AUA)* | Composite AUM | |
| 2022 | -6.94% | -7.41% | -7.98% | 25.12% | 21.84% | N/A | 1,834 | 1,341 | 493 | 74 | Five or fewer |
| 2021 | 24.69% | 24.07% | 25.37% | 24.22% | 19.61% | N/A | 2,718 | 1,540 | 1,178 | 51 | Five or fewer |
| 2020 | 7.68% | 7.13% | 2.87% | 24.54% | 20.24% | N/A | 2,192 | 599 | 1,593 | 29 | Five or fewer |
| 2019 | 12.50% | 11.94% | 26.26% | 14.24% | 12.01% | N/A | 5,435 | 3,843 | 1,592 | 55 | Five or fewer |
| 2018 | -5.21% | -5.69% | -8.58% | 12.90% | 11.06% | N/A | - | - | 452 | Five or fewer | |
| 2017 | 17.53% | 16.95% | 13.19% | 13.71% | 10.33% | N/A | - | - | 52 | Five or fewer | |
| 2016 | 23.07% | 22.46% | 18.40% | 13.91% | 10.97% | N/A | - | - | 62 | Five or fewer | |
| 2015 | 3.67% | 3.16% | -4.13% | 12.46% | 10.74% | N/A | - | - | 3 | Five or fewer | |
| 2014 | 9.03% | 8.49% | 12.70% | 10.19% | 9.36% | N/A | - | - | 4 | Five or fewer | |
| 2013 | 47.65% | 46.94% | 32.69% | N/A 1 | N/A 1 | N/A | - | - | 9 | Five or fewer | |
*Firm-wide advisory- only assets. Assets under Advisement (AUA) includes the assets where Easterly Investment Partners (“Easterly”) provides its advisory services in similar strategies and does not have discretionary trading authority.
N/A1 – Information is not shown as 36 months of performance is not available.
Firm Definition
For purposes of complying with the GIPS® standards, the firm is defined as Easterly Investment Partners LLC (“EIP”) which is an SEC registered investment adviser under the U.S. Investment Advisers Act of 1940, as amended, effective January 2019. The firm was redefined on 1/1/2023 to reflect that EIP is comprised of two distinct firms: the institutional asset management operations, investment strategies, performance track records, certain employees and client accounts of Levin Capital Strategies, which were acquired by EIP in March 2019, and Snow Capital Management LLC’s (“SCM”) asset management business, investment strategies, performance track records, client accounts, and certain employees, acquired by EIP in July 2021.
Firm Verification Statement
Easterly claims compliance with the Global Investment Performance Standards (GIPS®) and has prepared and presented this report in compliance with the GIPS standards. Easterly has been independently verified for the period April 1, 2019 through December 31, 2022. A firm that claims compliance with the GIPS standards must establish policies and procedures for complying with all the applicable requirements of the GIPS standards. Verification provides assurance on whether the firm’s policies and procedures related to composite and pooled fund maintenance, as well as the calculation, presentation, and distribution of performance, have been designed in compliance with the GIPS standards and have been implemented on a firm-wide basis.
Composite Verification Statement
The All Cap Value Composite has had a performance examination from composite inception date through December 31, 2022. The verification and performance examination reports are available upon request.
Composite Description
The All Cap Value composite provides exposure to long-only US publicly-traded equities and ADRs, and may occasionally invest in convertible and corporate bonds considering various factors. The strategy is conviction weighted and biased toward All Cap value stocks, and typically maintains 30 to 40 positions, which may be more or less during various periods.
Benchmark Description
The Russell 3000® Value Total Return Index is composed of 3000 large U.S. companies, as determined by market capitalization. This portfolio of securities represents approximately 98% of the investable U.S. equity market. The Russell 3000® is comprised of stocks within the Russell 1000® and the Russell 2000® indices.The total return index is the price level index plus the dividend reinvested. Indexes are unmanaged. It is not possible to invest directly in an index.
The S&P 500 Index was retroactively removed as of 10/1/2022.
Performance Calculation
All returns are calculated and presented in US dollars based on fully discretionary AUM, including those investors no longer with the firm. All gross composite returns are net of transaction costs and gross of foreign withholding taxes, if any, and reflect the reinvestment of interest income and other earnings. Net performance results reflect the application of a model investment management fee which is higher than the actual average weighted management fee charged to accounts in the composite applied to gross performance results. Actual fees may vary depending on, among other things, the applicable fee schedule and portfolio size. Actual investment advisory fees incurred by clients will vary. Policies for valuing investments, calculating performance, and preparing GIPS reports are available upon request. A list of composite descriptions is available upon request. Past performance is not indicative of future performance. Results may be higher or lower based on IPO eligibility, and actual investor’s returns may differ, depending upon date(s) of investment(s). Additional information is available upon request.
Investment Management Fee Schedule
The current standard management fee schedule for a segregated account managed to the composite strategy is as follows: 0.50% on assets.
Composite Dispersion
The annual composite dispersion, if shown, is an asset-weighted standard deviation calculated using gross returns for the accounts in the composite the entire year. The internal dispersion measure is not applicable if there are five or fewer portfolios in the composite for the entire year if that is the reason this is N/A.
Standard Deviation
The annualized 3-year standard deviation represents the annualized standard deviation of actual gross composite and benchmark returns, using the rolling 36 months ended each year end. Standard deviation is a measurement of historical volatility of investment returns.
Trademark
GIPS® is a registered trademark of CFA Institute. CFA Institute does not endorse or promote this organization, nor does it warrant the accuracy or quality of the content contained herein.
Important Disclosures
© 2023. Easterly Asset Management. All rights reserved.
Easterly Asset Management’s advisory affiliates (collectively, “EAM” or “the Firm”), including Easterly Investment Partners LLC, Easterly Funds LLC, and Easterly EAB Risk Solutions LLC (“Easterly EAB”) are registered with the SEC as investment advisers under the Investment Advisers Act of 1940, as amended. Registration does not imply a certain level of skill or training. More information about the firm, including its investment strategies and objectives, can be found in each affiliate’s Form ADV Part 2 which is available on the www.sec.gov website. This information has been prepared solely for the use of the intended recipients; it may not be reproduced or disseminated, in whole or in part, without the prior written consent of EAM.
No funds or investment services described herein are offered or will be sold in any jurisdiction in which such an offer or sale would be unlawful under the laws of such jurisdiction. No such fund or service is offered or will be sold in any jurisdiction in which registration, licensing, qualification, filing or notification would be required unless such registration, license, qualification, filing, or notification has been effected.
The material contains information regarding the investment approach described herein and is not a complete description of the investment objectives, risks, policies, guidelines or portfolio management and research that supports this investment approach. Any decision to engage the Firm should be based upon a review of the terms of the prospectus, offering documents or investment management agreement, as applicable, and the specific investment objectives, policies and guidelines that apply under the terms of such agreement. There is no guarantee investment objectives will be met. The investment process may change over time. The characteristics set forth are intended as a general illustration of some of the criteria the strategy team considers in selecting securities for client portfolios. Client portfolios are managed according to mutually agreed upon investment guidelines. No investment strategy or risk management techniques can guarantee returns or eliminate risk in any market environment. All information in this communication has been obtained from sources believed to be reliable but cannot be guaranteed. Investment products are not FDIC insured and may lose value.
Investments are subject to market risk, including the loss of principal. Nothing in this material constitutes investment, legal, accounting or tax advice, or a representation that any investment or strategy is suitable or appropriate. The information contained herein does not consider any investor’s investment objectives, particular needs, or financial situation and the investment strategies described may not be suitable for all investors. Individual investment decisions should be discussed with a personal financial advisor.
Any opinions, projections and estimates constitute the judgment of the portfolio managers as of the date of this material, may not align with the Firm’s opinion or trading strategies, and may differ from other research analysts’ opinions and investment outlook. The information herein is subject to change without notice and may be superseded by subsequent market events or for other reasons. EAM assumes no obligation to update the information herein.
References to securities, transactions or holdings should not be considered a recommendation to purchase or sell a particular security and there is no assurance that, as of the date of publication, the securities remain in the portfolio. Additionally, it is noted that the securities or transactions referenced do not represent all of the securities purchased, sold or recommended during the period referenced and there is no guarantee as to the future profitability of the securities identified and discussed herein. As a reminder, investment return and principal value will fluctuate.
The indices cited are, generally, widely accepted benchmarks for investment performance within their relevant regions, sectors or asset classes, and represent non managed investment portfolio. It is not possible to invest directly in an index.
This communication may contain forward-looking statements, which reflect the views of EAM and/or its affiliates. These forward-looking statements can be identified by reference to words such as “believe”, “expect”, “potential”, “continue”, “may”, “will”, “should”, “seek”, “approximately”, “predict”, “intend”, “plan”, “estimate”, “anticipate” or other comparable words. These forward-looking statements or other predications or assumptions are subject to various risks, uncertainties, and assumptions. Accordingly, there are or will be important factors that could cause actual outcomes or results to differ materially from those indicated in these statements. Should any assumptions underlying the forward-looking statements contained herein prove to be incorrect, the actual outcome or results may differ materially from outcomes or results projected in these statements. EAM does not undertake any obligation to update or review any forward-looking statement, whether as a result of new information, future developments or otherwise, except as required by applicable law or regulation.
Past performance is no guarantee of future results.