Market Summary
The U.S. economy demonstrated notable resilience during the first quarter of 2024, surpassing expectations and contributing to signs of global economic stabilization. The reported year-over-year inflation rate decreased significantly, dropping from 9% to 3%. This decline is largely attributed to the aggressive rate hikes implemented by the Federal Reserve over the past fifteen months, elevating the Fed Funds rate from 0.25% to 5.50%.
Amidst these developments, the Fed hinted at a potential shift toward a more accommodating monetary policy following a period of rapid tightening. This prospect has eased financial conditions and bolstered investor confidence, particularly rejuvenating cyclical sectors since the latter half of 2023. Large Cap stocks saw robust performance in Q1, fueled by expectations of impending rate cuts. However, persistently high inflation poses a challenge to the Fed’s ability to lower rates in the short term, especially under the scrutiny of an election cycle.
Despite inflation pressures remaining a global concern, the Fed’s balance sheet reduction continues, having decreased from a high of $9 trillion during the pandemic to approximately $7.5 trillion. The pace of this reduction—up to $95 billion per month—highlights a strategic withdrawal from the market-enhancing purchases of past years, suggesting that a return to aggressive asset purchases is unlikely in the near term against the backdrop of ongoing inflation.
The first quarter also saw signs of economic optimism, underscored by robust job growth and low unemployment rates. However, there are emerging concerns as consumer behavior shows significant shifts. The reliance on credit has intensified, particularly among lower-income groups, with credit card debt surpassing $1.1 trillion—a record high. Additionally, changing spending habits among younger demographics and rising delinquency rates in various debt categories highlight growing financial strains.
Corporate debt levels are under scrutiny as companies previously buoyed by low interest rates now face the reality of refinancing at significantly higher costs. Similarly, the burgeoning federal deficit, which exceeded $2 trillion in the past year, presents a daunting fiscal challenge, compounded by a near 40% increase in interest payments in 2023 alone.
U.S. equities thrived in Q1 2024, with the S&P 500 climbing 10.2% and breaking past the 5,200 level for the first time, driven by solid corporate earnings and sustained consumer spending. Sector-wise, Communication Services, Energy, and Information Technology led the gains, with broad market strength indicated by over 80% of S&P 500 constituents trading above their 200-day moving averages.
Performance Highlights
The overall performance of the EIP Large Cap Value strategy in the first quarter of 2024 was significantly stronger than the Russell 1000 Value benchmark by 356 basis points, primarily due to stock selection, with minimal impact from asset allocation. We believe this strong relative and absolute performance underscores the effectiveness of the portfolio’s management strategies.
On a sector level, Consumer Staples, Information Technology, and Industrials were notable for their positive contributions to the portfolio’s performance, driven mainly by stock selection. These gains helped offset the underperformance in Financials, Energy, and the allocation to Cash, which, although cautious, curbed gains during the strong market period. Financials were negatively impacted by both allocation and selection effects, whereas Consumer Staples benefited significantly from an overweight position and superior stock returns.
In summary, despite some sectoral weightings being driven by bottom-up stock selection that led to negative sector attribution, the portfolio’s overall performance benefitted from a strategic focus on high-value stock picks, confirming the portfolio management’s adeptness at navigating complex market dynamics.
Portfolio Attribution
Top 5 Performance Contributors
| Stock | Avg Weight % | Contribution % |
|---|---|---|
| TAIWAN SEMICONDUCTOR-SP ADR | 4.11 | 1.28 |
| MICRON TECHNOLOGY INC | 2.61 | 0.99 |
| MERCK & CO. INC. | 3.67 | 0.98 |
| TARGET CORP | 3.44 | 0.94 |
| ENCORE WIRE CORP | 3.07 | 0.80 |
Taiwan Semiconductor Manufacturing (TSM)
Taiwan Semiconductor Manufacturing (TSM) experienced a significant surge in its stock performance during the 1st quarter of 2024, vastly outstripping the Information Technology sector’s performance. This impressive result was underpinned by strategic expansions and technological advancements. Notably, TSMC announced investments exceeding $20 billion to construct a second manufacturing facility in Japan, signaling robust growth initiatives. Additionally, the company’s commitment to enhancing AI chip production capabilities contributed to a buoyant revenue forecast, projecting over 20% growth in 2024. These proactive steps, combined with a bullish market sentiment towards TSMC’s role in AI applications, underscore the company’s strong quarterly performance, positioning it well for sustained growth.
Micron Technology Inc (MU)
Micron Technology Inc (MU) exhibited stellar performance in the 1st quarter of 2024, significantly outperforming the Information Technology sector’s return of 6.92%. This impressive performance can be attributed to several key factors, including a surprise profit and revenue that soared past expectations due to heightened demand for AI-driven applications. Notably, Micron’s Q2 fiscal results highlighted a revenue increase to $5.82 billion and adjusted earnings per share of $0.42, both surpassing analyst expectations.
Merck & Co Inc (MRK)
Merck & Co Inc (MRK) achieved a significant return in the first quarter of 2024, outperforming the Health Care sector. This success was primarily fueled by robust sales of Keytruda and Gardasil, as well as the strategic expansion of its oncology and vaccine portfolios. Keytruda, now the world’s biggest-selling prescription medicine, continues to drive substantial revenue growth, contributing to a quarterly revenue boost of 21% year-over-year. Notably, the FDA’s approval of new treatments for rare diseases and Merck’s proactive moves in clinical trials, such as testing a single-dose regimen of Gardasil 9, further underscored its innovative edge and market responsiveness. The company’s agile adaptation to market demands and continuous development in high-stakes areas like oncology and vaccines poise it for sustained growth.
Top 5 Performance Detractors
| Stock | Avg Weight % | Contribution % |
|---|---|---|
| BAYER AG-SPONSORED ADR | 1.52 | -0.51 |
| BOEING CO/THE | 1.20 | -0.51 |
| BIOGEN INC | 2.28 | -0.41 |
| AMERICOLD REALTY TRUST INC | 1.46 | -0.25 |
| MARCUS CORPORATION | 0.43 | -0.08 |
Bayer AG (BAY)
Bayer AG (BAY) experienced a notable decline in the Q1 2024, underperforming the Health Care sector. This underperformance is primarily attributed to substantial legal challenges and financial setbacks. The company faced several high-profile legal defeats regarding its Roundup weedkiller, including a staggering $2.25 billion verdict, contributing to a significant financial strain and a 95% dividend cut to manage litigation expenses. Furthermore, the U.S. appeals court’s decision not to shield Bayer from Roundup lawsuits has heightened the financial uncertainty surrounding the company. The investment thesis for Bayer AG is currently deemed invalid, leading to an exit of the position. The ongoing and unresolved legal challenges surrounding Roundup weedkiller present too great a financial risk, overshadowing the company’s operational advancements in pharmaceuticals and crop science. With Bayer’s share price experiencing significant volatility and hitting historical lows, the risk-reward balance is unfavorably tilted towards high risk, prompting the discontinuation of investment.
Boeing Co. (BA)
Boeing Co. (BA) underperformed significantly in the 1st quarter of 2024, despite the Industrials sector gaining 11.82%. Several factors contributed to this decline, notably a series of management upheavals and safety concerns. The departure of CEO Dave Calhoun and other key executives amid these crises signals deep internal challenges. Financially, the company’s struggle was accentuated by Moody’s review for a potential downgrade, reflecting heightened financial risk and instability. Coupled with ongoing competition from Airbus and emerging Chinese manufacturers, Boeing faced intensified pressure on multiple fronts. Boeing’s current market position and internal challenges suggest a period of significant transition and uncertainty. Despite being a leading aerospace manufacturer, the company’s ongoing safety issues and executive turnover highlight deep-seated problems that may continue to affect its performance negatively. Given these considerations, and acknowledging the complex recovery ahead, the investment thesis previously posited is no longer valid, and the position has been exited. This decision reflects the increased risk profile and uncertain recovery trajectory for Boeing.
Biogen Inc (BIIB)
Biogen Inc (BIIB) underperformed in Q1 2024 against a more robust Health Care sector performance. Several factors contributed to this decline. Firstly, the company faced increased costs and disappointing sales from its multiple sclerosis therapies, significantly impacting its financial results. Additionally, Biogen discontinued the development and commercialization of its Alzheimer’s drug, Aduhelm, after reassessing its viability and market potential, which led to substantial exit costs and a negative impact on earnings as reported in the fourth quarter. Furthermore, the launch of the new Alzheimer’s treatment, Leqembi, has been slow, failing to offset declines in other areas. This quarter also saw the company receiving a subpoena from the DOJ, probing its operations in foreign countries, adding to investor concerns over potential legal and compliance risks.
Source: SEI Global Services.
Securities shown represent the highest contributors and detractors to the portfolio’s performance for the period and do not represent all holdings within the portfolio. There is no guarantee that such holdings currently or will remain in the portfolio. For a complete list of holdings and an explanation of the methodology employed to determine this information, please contact Easterly. This information is not to be construed as an offer to buy or sell any financial instrument nor does it constitute an offer or invitation to invest in any fund managed by Easterly and has not been prepared in connection with any such offer.
Trailing Performance
as of March 31, 2024
| QTD | YTD | 1 Year | 3 Year | 5 Year | 7 Year | 10 Year | Since Inception* | |
|---|---|---|---|---|---|---|---|---|
| Composite (gross) | 12.67% | 12.67% | 24.21% | 9.75% | 10.26% | 9.24% | 10.32% | 9.48% |
| Composite (net) | 12.55% | 12.55% | 23.65% | 9.26% | 9.77% | 8.75% | 9.83% | 8.99% |
| Russell 1000 Value | 8.99% | 8.99% | 20.27% | 8.10% | 10.30% | 9.15% | 9.00% | 7.21% |
Calendar Year Performance
| 2023 | 2022 | 2021 | 2020 | 2019 | 2018 | 2017 | 2016 | 2015 | 2014 | |
|---|---|---|---|---|---|---|---|---|---|---|
| Composite (Gross) | 11.20% | -3.13% | 23.72% | 8.07% | 14.44% | -8.18% | 14.62% | 19.18% | 2.72% | 13.30% |
| Composite (Net) | 10.71% | -3.55% | 23.18% | 7.57% | 13.93% | -8.60% | 14.11% | 18.66% | 2.26% | 12.79% |
| Russell 1000 Value | 11.46% | -7.54% | 25.16% | 2.80% | 26.54% | -8.27% | 13.66% | 17.34% | -3.83% | 13.45% |
Source: SEI Global Services
*Inception: 1/1/07
Performance shown is the Easterly Investment Partners LLC (“the Firm”) Large Cap Value composite in USD. Past performance is not indicative of future results. Gross performance results do not include advisory fees and other expenses an investor may incur, which when deducted will reduce returns. Changes in exchange rates may have adverse effects. Net performance results reflect the application of a model investment management fee which is higher than the actual average weighted management fee charged to accounts in the composite applied to gross performance results. Actual fees may vary depending on, among other things, the applicable fee schedule and portfolio size. The Firm claims compliance with the GIPS® standards; this information is supplemental to the GIPS® report included in this material. Returns greater than one year are annualized.
Top 10 Holdings
| VIATRIS INC | 5.88% |
| CISCO SYSTEMS INC | 5.09% |
| INTL FLAVORS & FRAGRANCES | 5.01% |
| VERIZON COMMUNICATIONS INC | 5.01% |
| MORGAN STANLEY | 4.96% |
| GOLDMAN SACHS GROUP INC | 4.32% |
| MERCK & CO. INC. | 3.89% |
| TARGET CORP | 3.73% |
| DOW INC | 3.68% |
| EVERSOURCE ENERGY | 3.48% |
| Total | 45.05% |
|---|
Excludes cash and cash equivalents.
References to securities, transactions or holdings should not be considered a recommendation to purchase or sell a particular security and there is no assurance that, as of the date of publication, the securities remain in the portfolio. Additionally, it is noted that the securities or transactions referenced do not represent all of the securities purchased, sold or recommended during the period referenced and there is no guarantee as to the future profitability of the securities identified and discussed herein. Top ten holdings information shown combines share listings from the same issuer, and related depositary receipts, into a singular holding to accurately present aggregate economic interest in the referenced company.
Attribution vs Russell 1000 Value
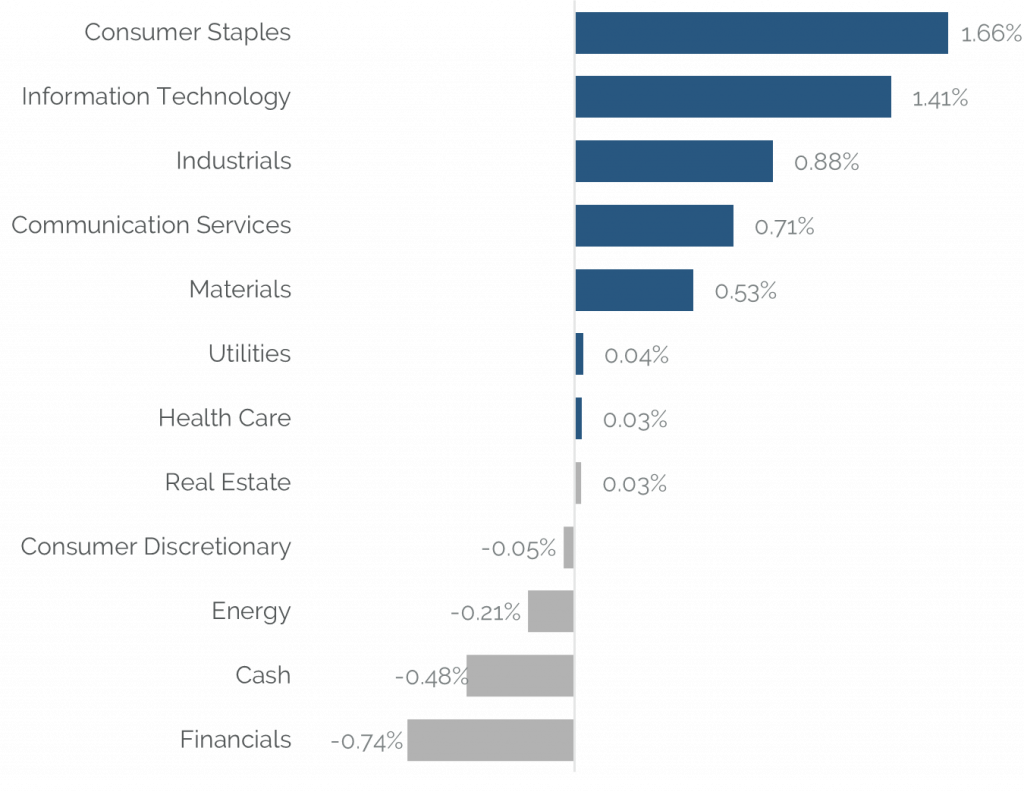
Source: Bloomberg
Holdings, sector weightings, market capitalization and portfolio characteristics are subject to change at any time and are based on a representative portfolio, and may differ, sometimes significantly, from individual client portfolios.
Outlook
As we look ahead to the remainder of 2024, our strategy at Easterly Investment Partners remains steadfastly committed to navigating the complexities of the current economic environment. The landscape this year is characterized by significant uncertainties, including fluctuations in monetary policy, the dynamics of a full U.S. election cycle, and continued geopolitical instability. These factors are expected to drive market volatility, yet they also present unique opportunities for active management.
Our EIP Large Cap Value Portfolio is well-positioned to capitalize on these conditions. We continue to focus on large-cap value stocks, recognizing the potential for strong value propositions especially if the Fed’s actions diverge from the expected rate cuts. Such a scenario could impact high-valuation mega-cap stocks more severely, where a prolonged higher discount rate could be applied to their future cash flows.
In conclusion, we remain dedicated to delivering robust long-term performance and maintaining clear, transparent communication with our investors. We appreciate the trust and commitment you have placed in Easterly Investment Partners and are always open to your feedback and queries.
Easterly Investment Partners LLC Large Cap Value Composite GIPS® Report
Composite Inception Date: January 1, 2007
Composite Creation Date: April 1, 2019
| Composite Performance | Annualized 3-Year Standard Deviation | Total Asset (millions) | |||||||||
|---|---|---|---|---|---|---|---|---|---|---|---|
| Year End | Gross | Net | Russell 1000® Value | Composite | Russell 1000® Value | Composite Dispersion | Total Firm Assets | Firm (AUM) | Firm (AUA)* | Composite AUM | Number of Accounts |
| 2023 | 11.20% | 10.71% | 11.46% | 16.89% | 16.74% | N/A | 1,730 | 1,090 | 640 | 250 | Five or fewer |
| 2022 | -3.13% | -3.55% | -7.54% | 24.41% | 21.55% | N/A | 1,834 | 1,341 | 493 | 449 | 6 |
| 2021 | 23.72% | 23.18% | 25.16% | 23.52% | 19.33% | 0.85% | 2,718 | 1,540 | 1,178 | 554 | 6 |
| 2020 | 8.07% | 7.57% | 2.80% | 23.83% | 19.90% | 0.80% | 2,192 | 599 | 1,593 | 509 | 6 |
| 2019 | 14.44% | 13.93% | 26.54% | 13.50% | 11.85% | 1.18% | 5,435 | 3,843 | 1,592 | 1,643 | 11 |
| 2018 | -8.18% | -8.60% | -8.27% | 11.54% | 10.82% | 0.37% | - | - | 2,079 | 18 | |
| 2017 | 14.62% | 14.11% | 13.66% | 11.80% | 10.20% | 0.31% | - | - | 3,198 | 22 | |
| 2016 | 19.18% | 18.66% | 17.34% | 12.29% | 10.77% | 0.40% | - | - | 3,105 | 21 | |
| 2015 | 2.72% | 2.26% | -3.83% | 11.37% | 10.68% | 0.28% | - | - | 2,900 | 22 | |
| 2014 | 13.30% | 12.79% | 13.45% | 10.27% | 9.20% | 0.33% | - | - | 3,178 | 23 | |
*Firm-wide advisory-only assets. Assets under Advisement (AUA) includes the assets where Easterly Investment Partners (“Easterly”) provides its advisory services in similar strategies and does not have discretionary trading authority.
Firm Definition
For purposes of complying with the GIPS® standards, the firm is defined as Easterly Investment Partners LLC (“EIP”) which is an SEC registered investment adviser under the U.S. Investment Advisers Act of 1940, as amended, effective January 2019. The firm was redefined on 1/1/2023 to reflect that EIP is comprised of two distinct firms: the institutional asset management operations, investment strategies, performance track records, certain employees and client accounts of Levin Capital Strategies, which were acquired by EIP in March 2019, and Snow Capital Management LLC’s (“SCM”) asset management business, investment strategies, performance track records, client accounts, and certain employees, acquired by EIP in July 2021.
Firm Verification Statement
Easterly claims compliance with the Global Investment Performance Standards (GIPS®) and has prepared and presented this report in compliance with the GIPS standards. Easterly has been independently verified for the period April 1, 2019 through December 31, 2023. A firm that claims compliance with the GIPS standards must establish policies and procedures for complying with all the applicable requirements of the GIPS standards. Verification provides assurance on whether the firm’s policies and procedures related to composite and pooled fund maintenance, as well as the calculation, presentation, and distribution of performance, have been designed in compliance with the GIPS standards and have been implemented on a firm-wide basis.
Composite Verification Statement
The Large Cap Value Composite has had a performance examination from composite inception date through December 31, 2023. The verification and performance examination reports are available upon request.
Composite Description
The Large Cap Value composite provides exposure to long-only US public equities and ADRs, with occasional investments in convertible and corporate bonds. The strategy is biased toward large capitalization value stocks, and typically maintains between 30 and 40 positions, but may be more or less concentrated during various periods.
Benchmark Description
The Russell 1000® Value Total Return Index measures the performance of the large-cap value segment of the U.S. equity universe. It includes those Russell 1000® Index companies with lower price-to-book ratios and lower expected growth values. The total return index is the price level index plus the dividend reinvested. Indexes are unmanaged. It is not possible to invest directly in an index.
The S&P 500 Index was retroactively removed as of 10/1/2022
Performance Calculation
All returns are calculated and presented in US dollars based on fully discretionary AUM, including those investors no longer with the firm. All gross composite returns are net of transaction costs and foreign withholding taxes, if any, and reflect the reinvestment of interest income and other earnings. Net performance results reflect the application of a model investment management fee which is higher than the actual average weighted management fee charged to accounts in the composite applied to gross performance results. Composite net returns are calculated by reducing the daily gross return by 1/12th of the highest advisory fee rate on day prior to month end (same day fees are booked), then linked with the daily returns to create the Monthly net return. Monthly net returns are then geometrically linked to calculate the annual net return. Actual fees may vary depending on, among other things, the applicable fee schedule and portfolio size. Actual investment advisory fees incurred by clients will vary. Policies for valuing investments, calculating performance, and preparing GIPS reports are available upon request. A list of composite descriptions and a list of broad distribution pooled funds are available upon request. Past performance is not indicative of future performance. Results may be higher or lower based on IPO eligibility, and actual investor’s returns may differ, depending upon date(s) of investment(s). Additional information is available upon request.
Investment Management Fee Schedule
The current standard management fee schedule for a segregated account managed to the composite strategy is as follows: 0.45% on assets.
Composite Dispersion
The annual composite dispersion, if shown, is an asset-weighted standard deviation calculated using gross returns for the accounts in the composite the entire year. The internal dispersion measure is not applicable if there are five or fewer portfolios in the composite for the entire year if that is the reason this is N/A.
Standard Deviation
The annualized 3-year standard deviation represents the annualized standard deviation of actual gross composite and benchmark returns, using the rolling 36 months ended each year end. Standard deviation is a measurement of historical volatility of investment returns.
Trademark
GIPS® is a registered trademark of CFA Institute. CFA Institute does not endorse or promote this organization, nor does it warrant the accuracy or quality of the content contained herein.
Important Disclosures
© 2024. Easterly Asset Management. All rights reserved.
Easterly Asset Management’s advisory affiliates (collectively, “EAM” or “the Firm”), including Easterly Investment Partners LLC, Easterly Funds LLC, and Easterly EAB Risk Solutions LLC (“Easterly EAB”) are registered with the SEC as investment advisers under the Investment Advisers Act of 1940, as amended. Registration does not imply a certain level of skill or training. More information about the firm, including its investment strategies and objectives, can be found in each affiliate’s Form ADV Part 2 which is available on the www.sec.gov website. This information has been prepared solely for the use of the intended recipients; it may not be reproduced or disseminated, in whole or in part, without the prior written consent of EAM.
No funds or investment services described herein are offered or will be sold in any jurisdiction in which such an offer or sale would be unlawful under the laws of such jurisdiction. No such fund or service is offered or will be sold in any jurisdiction in which registration, licensing, qualification, filing or notification would be required unless such registration, license, qualification, filing, or notification has been affected.
The material contains information regarding the investment approach described herein and is not a complete description of the investment objectives, risks, policies, guidelines or portfolio management and research that supports this investment approach. Any decision to engage the Firm should be based upon a review of the terms of the prospectus, offering documents or investment management agreement, as applicable, and the specific investment objectives, policies and guidelines that apply under the terms of such agreement. There is no guarantee investment objectives will be met. The investment process may change over time. The characteristics set forth are intended as a general illustration of some of the criteria the strategy team considers in selecting securities for client portfolios. Client portfolios are managed according to mutually agreed upon investment guidelines. No investment strategy or risk management techniques can guarantee returns or eliminate risk in any market environment. All information in this communication has been obtained from sources believed to be reliable but cannot be guaranteed. Investment products are not FDIC insured and may lose value.
Investments are subject to market risk, including the loss of principal. Nothing in this material constitutes investment, legal, accounting or tax advice, or a representation that any investment or strategy is suitable or appropriate. The information contained herein does not consider any investor’s investment objectives, particular needs, or financial situation and the investment strategies described may not be suitable for all investors. Individual investment decisions should be discussed with a personal financial advisor.
Any opinions, projections and estimates constitute the judgment of the portfolio managers as of the date of this material, may not align with the Firm’s opinion or trading strategies, and may differ from other research analysts’ opinions and investment outlook. The information herein is subject to change without notice and may be superseded by subsequent market events or for other reasons. EAM assumes no obligation to update the information herein.
References to securities, transactions or holdings should not be considered a recommendation to purchase or sell a particular security and there is no assurance that, as of the date of publication, the securities remain in the portfolio. Additionally, it is noted that the securities or transactions referenced do not represent all of the securities purchased, sold or recommended during the period referenced and there is no guarantee as to the future profitability of the securities identified and discussed herein. As a reminder, investment return and principal value will fluctuate.
The indices cited are, generally, widely accepted benchmarks for investment performance within their relevant regions, sectors or asset classes, and represent non managed investment portfolio. It is not possible to invest directly in an index.
This communication may contain forward-looking statements, which reflect the views of EAM and/or its affiliates. These forward-looking statements can be identified by reference to words such as “believe”, “expect”, “potential”, “continue”, “may”, “will”, “should”, “seek”, “approximately”, “predict”, “intend”, “plan”, “estimate”, “anticipate” or other comparable words. These forward-looking statements or other predications or assumptions are subject to various risks, uncertainties, and assumptions. Accordingly, there are or will be important factors that could cause actual outcomes or results to differ materially from those indicated in these statements. Should any assumptions underlying the forward-looking statements contained herein prove to be incorrect, the actual outcome or results may differ materially from outcomes or results projected in these statements. EAM does not undertake any obligation to update or review any forward-looking statement, whether as a result of new information, future developments or otherwise, except as required by applicable law or regulation.
Past performance is no guarantee of future results.
20240515-3568054