Market Summary
The equity market exhibited strong performance during the quarter, with most major indices posting double-digit gains. This positive momentum was largely attributable to robust corporate earnings, continued economic recovery, and expectations of accommodative monetary policies by the Federal Reserve. Small Cap Value stocks had a strong quarter, outperforming both their larger cap peers and growth stocks of all cap sizes. However, concerns about rising inflation and the potential for tapering of asset purchases by the Fed tempered some of the optimism. Additionally, supply chain disruptions and geopolitical tensions created pockets of volatility in the market.
2023 will go down as a unique year where broad equity returns, and the health of the underlying economy, were not perfectly correlated. Equity market performance was dominated by the “Magnificent Seven,” which account for approximately 30% of the S&P 500 and 40% of the Nasdaq 100 and have driven well over half of the total return for both indexes. This startling lack of breadth stands in stark contrast to historically healthy bull markets where a thriving economy benefits many companies to a similar degree. In the S&P 500 in 2023, the “Magnificent Seven” accounted for just under 16% of the total performance while the other 493 stocks accounted for approximately 10%.
Commentary from companies, industry regulators, and a wide array of economic data support the concept that all is not well in the economy. Consumers are struggling in the face of continued high inflation, and while slowing on a rate-of-change basis, it remains positive and structurally higher relative to pre-pandemic levels. This has taken time to show as savings had been elevated post-pandemic (peaking at about $2.3T) but have pulled back to about $0.7T. With consumer spending representing approximately 70% of US GDP, the cumulative pressure of persistent inflation is slowing the economy. Student loan payments have resumed and access to credit has become both more difficult and burdensome as rates remain high relative to the zero-interest-rate policy of the preceding decade. Certain asset classes such as bonds, oil, and the US dollar have been pricing in a recession throughout much of the year, while others, such as large-cap equity indexes and cryptocurrencies, were pricing in a risk-on environment.
While the Federal Reserve opened the door in mid-December to potential rate cuts in 2024, the market is reacting as if we are returning to near-zero interest rates, quantitative easing, helicopter money, and a stimulus payment environment, perhaps all at once! All of which are entirely unrealistic given the inflation backdrop and federal deficits. While the Fed’s comments resulted in a “dove-ish” risk-on rally, the rate cuts that are being extrapolated by the market are taking place over a shorter period than we envision. The timing of rate cuts is highly uncertain, seemingly changing with every piece of economic data. What is certain is that generationally tighter monetary policy conditions will have a lagged effect across the economy. These effects have started to show their signs yet and are not reflected in broad equity valuations.
Performance Highlights
The Snow Focused Value strategy outperformed during the quarter, returning 12.62% gross of fees (12.36% net of fees), while the Russell 1000 Value index gained 9.50%. For the calendar year, the strategy outpaced the index, returning 19.01% gross of fees (17.89% net of fees), while the index has gained only 11.46%.
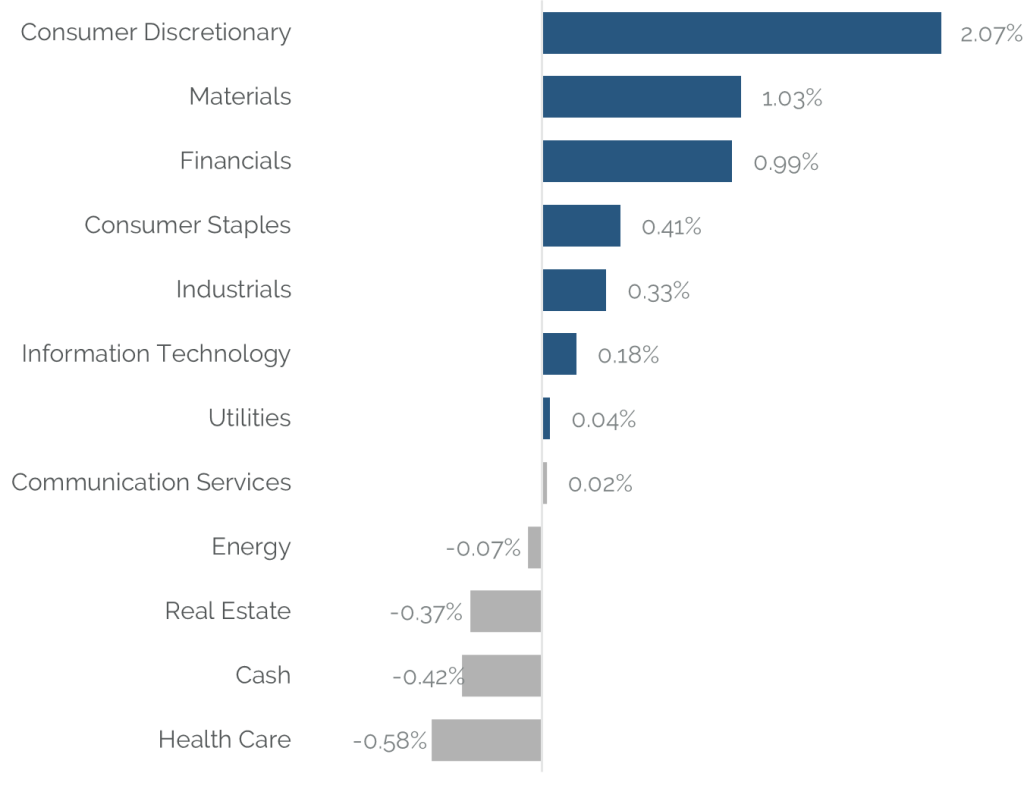
For the quarter, the Snow Focused Value strategy’s relative performance was driven entirely positive stock selection, as sector positioning detracted from relative performance. Stock selection was strongest in Consumer Discretionary, Materials and Financials, while being challenged in Health Care. From a sector standpoint, relative performance was hindered by its overweight position in both Energy and Health Care and its underweight in Real Estate.
Source: SEI Global Services as December 31, 2023
Performance shown is the Easterly Investment Partners LLC (“the Firm”) Snow Focused Value composite in USD. Past performance is not indicative of future results. Gross performance results do not include advisory fees and other expenses an investor may incur, which when deducted will reduce returns. Changes in exchange rates may have adverse effects. Net performance results reflect the application of a model investment management fee which is higher than the actual average weighted management fee charged to accounts in the composite applied to gross performance results. Actual fees may vary depending on, among other things, the applicable fee schedule and portfolio size. The Firm claims compliance with the GIPS® standards; this information is supplemental to the GIPS® report included in this material. Returns greater than one year are annualized.
Portfolio Attribution
Top 5 Performance Contributors
| Stock | Avg Weight % | Contribution % |
|---|---|---|
| PVH CORP | 5.02 | 2.66 |
| CITIGROUP | 4.83 | 1.23 |
| COLUMBIA BANKING SYSTEM | 3.42 | 1.12 |
| WESCO INTERNATIONAL | 4.96 | 1.05 |
| JPMORGAN CHASE & CO | 5.89 | 1.03 |
PVH Corp (PVH)
PVH shares rallied during the quarter, which was reflective of strong operational execution, against a backdrop of recessionary concerns. Specifically, strong gross margin performance highlighted operational improvements based on the PVH+ Plan. Management’s outlook for continued gross margin improvement in 2024 provided the market the necessary evidence that the PVH+ plan will help PVH deliver >$15/share in EPS. Shares are currently trading at 11X forward earnings.
Citigroup (C)
C shares gained as investors began to appreciate the company’s ongoing restructuring efforts amidst the improving economic backdrop. Citi’s strategic focus on core strengths and exiting non-profitable segments, such as the global distressed-debt business, contributed to outperformance in the quarter. Shares of C offer an attractive dividend yield of ~4% and trade for 0.6x book value.
Columbia Banking System (COLB)
Shares of COLB performed well as the company continues to implement integration initiatives following the merger of COLB/UMPQ. Earnings of $0.79/share beat expectations, helped by COLB realizing their annual cost-savings target one quarter ahead of plan. Performance was also driven by improved macro sentiment, as declining bond yields, helped by the Federal Reserve signaling they were at-or-near-the-peak of their rate-tightening cycle. The prospect of looser financial conditions and normalized credit drove a strong recovery in financial services during the final quarter of 2023.
Top 5 Performance Detractors
| Stock | Avg Weight % | Contribution % |
|---|---|---|
| PFIZER | 1.98 | -0.48 |
| MARATHON OIL CORP | 4.37 | -0.47 |
| SANOFI-ADR | 3.4 | -0.35 |
| SUNCOR ENERGY | 4.00 | -0.28 |
| BJ'S WHOLESALE CLUB HOLDINGS | 3.03 | -0.25 |
Pfizer (PFE)
PFE shares detracted during the quarter due in part to a larger than expected reduction in 2024 revenue forecasts, attributed to declining COVID-19 vaccine and treatment demand, and setbacks in obesity drug development leading to discontinuation. Investors have been disappointed in the capital deployment decisions PFE has made with the cash windfall they received from COVID product sales during 2021 and 2022.
Marathon Oil (MRO)
MRO shares declined despite continued strong operational performance, highlighted by better-than-expected earnings and production. However, macro uncertainty around a recession depressed stock performance for much of the energy sector. MRO maintains strong inventory position, with peer-leading breakeven production levels and best-in-class shareholder return policy. Over the past eight quarters ending September 30, MRO has repurchased 26% of its shares outstanding. These repurchases have facilitated increases to the base dividend, leading to a 12% annual shareholder yield at $75/barrel oil. Demand for commodities, particularly in a soft-landing scenario, should be supportive of oil and gas prices as greater capital discipline from U.S. producers helps to keep markets balanced.
Sanofi (SNY)
SNY shares lagged as the company reported disappointing quarterly earnings and a poorly communicated change to the company’s medium-term profitability outlook. Management now expects earnings per share to be down mid-single-digits in 2024, as the company looks to invest in R&D at a higher rate moving forward. While shares remain inexpensive on an earnings basis, pipeline development remains a longer-term narrative for the stock, and we chose to reallocate proceeds to positions with more immediate catalysts.
Source: SEI Global Services.
Securities shown represent the largest contributors and detractors to the portfolio’s performance for the period and do not represent all holdings within the portfolio. There is no guarantee that such holdings are currently or will remain in the portfolio. For a complete list of holdings and an explanation of the methodology employed to determine this information, please contact Easterly. This information is not to be construed as an offer to buy or sell any financial instrument nor does it constitute an offer or invitation to invest in any fund managed by Easterly and has not been prepared in connection with any such offer.
Trailing Performance
as of December 31, 2023
| QTD | YTD | 1 Yr | 3 Yr | 5 Yr | 7 Yr | 10 Yr | Since Inception* | |
|---|---|---|---|---|---|---|---|---|
| Composite (gross) | 12.62% | 19.01% | 19.01% | 15.76% | 15.28% | 10.13% | 7.86% | 14.26% |
| Composite (net) | 12.36% | 17.89% | 17.89% | 14.67% | 14.19% | 9.10% | 6.84% | 13.19% |
| Russell 1000 Value | 9.50% | 11.46% | 11.46% | 8.86% | 10.90% | 8.32% | 8.39% | 11.21% |
Calendar Year Performance
| 2023 | 2022 | 2021 | 2020 | 2019 | 2018 | 2017 | 2016 | 2015 | 2014 | |
|---|---|---|---|---|---|---|---|---|---|---|
| Composite (gross) | 19.01% | -1.11% | 31.80% | 2.56% | 28.00% | -18.03% | 17.76% | 15.10% | -18.20% | 15.17% |
| Composite (net) | 17.89% | -2.04% | 30.57% | 1.59% | 26.81% | -18.81% | 16.66% | 14.03% | -18.99% | 14.10% |
| Russell 1000 Value | 11.46% | -7.54% | 25.16% | 2.80% | 26.54% | -8.27% | 13.66% | 17.34% | -3.83% | 13.45% |
Source: SEI Global Services
Inception: 12/31/08
Performance shown is the Easterly Investment Partners LLC (“the Firm”) Snow Focused Value composite in USD. Past performance is not indicative of future results. Gross performance results do not include advisory fees and other expenses an investor may incur, which when deducted will reduce returns. Changes in exchange rates may have adverse effects. Net performance results reflect the application of a model investment management fee which is higher than the actual average weighted management fee charged to accounts in the composite applied to gross performance results. Actual fees may vary depending on, among other things, the applicable fee schedule and portfolio size. The Firm claims compliance with the GIPS® standards; this information is supplemental to the GIPS® report included in this material. Returns greater than one year are annualized.
Top 10 Holdings
| JPMORGAN CHASE & CO | 6.04% |
| WESCO INTERNATIONAL INC | 5.27% |
| CITIGROUP INC | 5.14% |
| CENTENE CORP | 4.84% |
| OPEN TEXT CORP | 4.75% |
| PVH CORP | 4.57% |
| COLUMBIA BANKING SYSTEM INC | 4.46% |
| LINCOLN NATIONAL CORP | 4.41% |
| FMC CORP | 4.29% |
| COMMERCIAL METALS CO | 4.14% |
| Total | 47.91% |
|---|
Excludes cash and cash equivalents.
References to securities, transactions or holdings should not be considered a recommendation to purchase or sell a particular security and there is no assurance that, as of the date of publication, the securities remain in the portfolio. Additionally, it is noted that the securities or transactions referenced do not represent all of the securities purchased, sold or recommended during the period referenced and there is no guarantee as to the future profitability of the securities identified and discussed herein. Top ten holdings information shown combines share listings from the same issuer, and related depositary receipts, into a singular holding to accurately present aggregate economic interest in the referenced company.
Attribution vs Russell 1000 Value
Source: Bloomberg
Holdings, sector weightings, market capitalization and portfolio characteristics are subject to change at any time and are based on a representative portfolio, and may differ, sometimes significantly, from individual client portfolios.
Outlook
We view the economy as much weaker than what the market is pricing in and we question whether investors will be willing to continue to pay 20x earnings for the S&P 500 going forward. This is considering a softening environment where the implied equity risk premium is at-or-near zero when compared to available bond yields. Fortunately, as active managers, the lack of breadth leads to a wide valuation dispersion, meaning that there are areas of opportunity where stocks are priced attractively. We continue to find stocks with idiosyncratic catalysts and asymmetric payouts, with great balance sheets, and ample free-cash-flow with which to populate our portfolio.
Over the past eleven recessions, small cap equities have outperformed mid-and-large caps by mid-double-digits when emerging from those recessionary periods. As profits begin to recover, we expect small caps to lead given the breadth and outsized cyclicality of small cap stocks relative to their larger peers. We are not adding to cyclical names at current market valuation levels but are instead finding stocks with lower correlations to GDP and more “self-help” type catalysts. Our cyclical holdings have performed very well, especially following the recent Fed announcement that rate cuts should be expected in 2024.
We continue to question the reverberation of higher interest rates throughout the economy. We do not believe the market has priced in some items, such as the $1T in corporate debt that will expire each year from 2025 – 2028, where businesses will have to either roll the debt at higher rates, shrink to the point where their cash flows are aligned with higher borrowing costs, or declare bankruptcy and wipe out equity holders. The Fed Funds rate going down to 4% does not save all of these companies, as recent market behavior is implying. We also question the impact of higher rates on federal deficits. With an annual deficit of more than $2T, as a percentage of GDP (about 8%) the deficit is larger than any fiscal year in history where the country did not face a war, recession, or other major emergency. With US Debt/GDP having risen from 35% in 2007 to greater than 90% now, higher spending on structurally higher debt levels will come with a higher cost to service. Yields will also likely need to move higher to attract buyers, given the Fed’s attempt to reduce their own balance sheet (let alone being an active purchaser) and less purchasing activity from foreign entities. We view this as a long-term structural headwind that will continue to suppress the equity market risk premium, specifically for indexes where valuations are near historical highs.
In closing, we remain dedicated to delivering strong long-term performance and transparent communications to our investors. Thank you for your confidence and commitment in Easterly Investment Partners. As always, we welcome your comments and questions.
Easterly Investment Partners LLC Snow Focused Value Composite GIPS® Report
Composite Inception Date: December 31, 2008
Composite Creation Date: 07/01/2021
| Composite Performance | Annualized 3-Year Standard Deviation | Total Assets (millions) | |||||||||
|---|---|---|---|---|---|---|---|---|---|---|---|
| Year End | Gross | Net | Russell 1000 Value | Composite | Russell 1000 Value | Composite Dispersion | Total Firm Assets | Firm (AUM) | Firm (AUA)* | Composite | Number of Accounts |
| 2023 | 19.01% | 17.89% | 11.46% | 18.35% | 16.74% | 0.16% | 1,730 | 1,090 | 640 | 17 | 6 |
| 2022 | -1.11% | -2.04% | -7.54% | 25.73% | 21.55% | N/A | 1,834 | 1,341 | 493 | 1 | Five or fewer |
| 2021 | 31.80% | 30.57% | 25.16% | 24.28% | 19.33% | N/A | 2718 | 1540 | 1178 | 30 | Five or fewer |
| 2020 | 2.56% | 1.59% | 2.80% | 24.63% | 19.62% | 0.10% | - | - | 26 | 10 | |
| 2019 | 28.00% | 26.81% | 26.54% | 14.90% | 11.90% | 0.14% | - | - | 31 | 9 | |
| 2018 | -18.03% | -18.81% | -8.27% | 15.30% | 10.80% | 0.05% | - | - | 3 | 8 | |
| 2017 | 17.76% | 16.66% | 13.66% | 16.65% | 10.20% | 0.06% | - | - | 5 | 8 | |
| 2016 | 15.10% | 14.03% | 17.34% | 17.07% | 10.77% | N/A | - | - | 25 | 6 | |
| 2015 | -18.20% | -18.99% | -3.83% | 15.63% | 10.68% | N/A | - | - | 26 | 7 | |
| 2014 | 15.17% | 14.10% | 13.45% | 13.98% | 9.20% | N/A | - | - | 37 | Five or Fewer | |
*Firm-wide advisory- only assets. Assets under Advisement (AUA) includes the assets where Easterly Investment Partners (“Easterly”) provides its advisory services in similar strategies and does not have discretionary trading authority.
Firm Definition
For purposes of complying with the GIPS® standards, the firm is defined as Easterly Investment Partners LLC (“EIP”) which is an SEC registered investment adviser under the U.S. Investment Advisers Act of 1940, as amended, effective January 2019. The firm was redefined on 1/1/2023 to reflect that EIP is comprised of two distinct firms: the institutional asset management operations, investment strategies, performance track records, certain employees and client accounts of Levin Capital Strategies, which were acquired by EIP in March 2019, and Snow Capital Management LLC’s (“SCM”) asset management business, investment strategies, performance track records, client accounts, and certain employees, acquired by EIP in July 2021.
Firm Verification Statement
Easterly claims compliance with the Global Investment Performance Standards (GIPS®) and has prepared and presented this report in compliance with the GIPS standards. Easterly has been independently verified for the period April 1, 2019 through December 31, 2022. A firm that claims compliance with the GIPS standards must establish policies and procedures for complying with all the applicable requirements of the GIPS standards. Verification provides assurance on whether the firm’s policies and procedures related to composite and pooled fund maintenance, as well as the calculation, presentation, and distribution of performance, have been designed in compliance with the GIPS standards and have been implemented on a firm-wide basis.
Composite Verification Statement
The Focused Value Composite has had a performance examination from composite inception date through December 31, 2022. The verification and performance examination reports are available upon request.
Composite Description
The Focused Value composite provides concentrated exposure to the mid- and large-capitalization segments of the value equity market.
Benchmark Description
The Russell 1000® Value Total Return Index measures the performance of the large-cap value segment of the U.S. equity universe. It includes those Russell 1000® Index companies with lower price-to-book ratios and lower expected growth values. The total return index is the price level index plus the dividend reinvested. Indexes are unmanaged. It is not possible to invest directly in an index.
Performance Calculation
All returns are calculated and presented in US dollars based on fully discretionary AUM, including those investors no longer with the firm. All gross composite returns are net of transaction costs and gross of foreign withholding taxes, if any, and reflect the reinvestment of interest income and other earnings. Net performance results reflect the application of a model investment management fee which is higher than the actual average weighted management fee charged to accounts in the composite applied to gross performance results. Actual fees may vary depending on, among other things, the applicable fee schedule and portfolio size. Actual investment advisory fees incurred by clients will vary. Policies for valuing investments, calculating performance, and preparing GIPS reports are available upon request. A list of composite descriptions is available upon request. Past performance is not indicative of future performance. Results may be higher or lower based on IPO eligibility, and actual investor’s returns may differ, depending upon date(s) of investment(s). Additional information is available upon request.
Investment Management Fee Schedule
The current standard management fee schedule for a segregated account managed to the composite strategy is as follows: 0.95% on assets.
Composite Dispersion
The annual composite dispersion, if shown, is an asset-weighted standard deviation calculated using gross returns for the accounts in the composite the entire year. The internal dispersion measure is not applicable if there are five or fewer portfolios in the composite for the entire year if that is the reason this is N/A.
Standard Deviation
The annualized 3-year standard deviation represents the annualized standard deviation of actual gross composite and benchmark returns, using the rolling 36 months ended each year end. Standard deviation is a measurement of historical volatility of investment returns.
Trademark
GIPS® is a registered trademark of CFA Institute. CFA Institute does not endorse or promote this organization, nor does it warrant the accuracy or quality of the content contained herein.
Important Disclosures
© 2024. Easterly Asset Management. All rights reserved.
Easterly Asset Management’s advisory affiliates (collectively, “EAM” or “the Firm”), including Easterly Investment Partners LLC, Easterly Funds LLC, and Easterly EAB Risk Solutions LLC (“Easterly EAB”) are registered with the SEC as investment advisers under the Investment Advisers Act of 1940, as amended. Registration does not imply a certain level of skill or training. More information about the firm, including its investment strategies and objectives, can be found in each affiliate’s Form ADV Part 2 which is available on the www.sec.gov website. This information has been prepared solely for the use of the intended recipients; it may not be reproduced or disseminated, in whole or in part, without the prior written consent of EAM.
No funds or investment services described herein are offered or will be sold in any jurisdiction in which such an offer or sale would be unlawful under the laws of such jurisdiction. No such fund or service is offered or will be sold in any jurisdiction in which registration, licensing, qualification, filing or notification would be required unless such registration, license, qualification, filing, or notification has been affected.
The material contains information regarding the investment approach described herein and is not a complete description of the investment objectives, risks, policies, guidelines or portfolio management and research that supports this investment approach. Any decision to engage the Firm should be based upon a review of the terms of the prospectus, offering documents or investment management agreement, as applicable, and the specific investment objectives, policies and guidelines that apply under the terms of such agreement. There is no guarantee investment objectives will be met. The investment process may change over time. The characteristics set forth are intended as a general illustration of some of the criteria the strategy team considers in selecting securities for client portfolios. Client portfolios are managed according to mutually agreed upon investment guidelines. No investment strategy or risk management techniques can guarantee returns or eliminate risk in any market environment. All information in this communication has been obtained from sources believed to be reliable but cannot be guaranteed. Investment products are not FDIC insured and may lose value.
Investments are subject to market risk, including the loss of principal. Nothing in this material constitutes investment, legal, accounting or tax advice, or a representation that any investment or strategy is suitable or appropriate. The information contained herein does not consider any investor’s investment objectives, particular needs, or financial situation and the investment strategies described may not be suitable for all investors. Individual investment decisions should be discussed with a personal financial advisor.
Any opinions, projections and estimates constitute the judgment of the portfolio managers as of the date of this material, may not align with the Firm’s opinion or trading strategies, and may differ from other research analysts’ opinions and investment outlook. The information herein is subject to change without notice and may be superseded by subsequent market events or for other reasons. EAM assumes no obligation to update the information herein.
References to securities, transactions or holdings should not be considered a recommendation to purchase or sell a particular security and there is no assurance that, as of the date of publication, the securities remain in the portfolio. Additionally, it is noted that the securities or transactions referenced do not represent all of the securities purchased, sold or recommended during the period referenced and there is no guarantee as to the future profitability of the securities identified and discussed herein. As a reminder, investment return and principal value will fluctuate.
The indices cited are, generally, widely accepted benchmarks for investment performance within their relevant regions, sectors or asset classes, and represent non managed investment portfolio. It is not possible to invest directly in an index.
This communication may contain forward-looking statements, which reflect the views of EAM and/or its affiliates. These forward-looking statements can be identified by reference to words such as “believe”, “expect”, “potential”, “continue”, “may”, “will”, “should”, “seek”, “approximately”, “predict”, “intend”, “plan”, “estimate”, “anticipate” or other comparable words. These forward-looking statements or other predications or assumptions are subject to various risks, uncertainties, and assumptions. Accordingly, there are or will be important factors that could cause actual outcomes or results to differ materially from those indicated in these statements. Should any assumptions underlying the forward-looking statements contained herein prove to be incorrect, the actual outcome or results may differ materially from outcomes or results projected in these statements. EAM does not undertake any obligation to update or review any forward-looking statement, whether as a result of new information, future developments or otherwise, except as required by applicable law or regulation.
Past performance is no guarantee of future results.