Market Summary
In Q2 2024, capital market participants continued to sift through various economic indicators looking for any signal that the Federal Reserve (the “Fed”) would begin to cut interest rates. The market’s yearning for rate cuts began in earnest in Q4 2023 and has driven outperformance in pockets of the market, where companies may benefit from a lower discount rate and borrowing costs. With the market at one point pricing in upwards of seven rate cuts this year, the Fed funds rate remains at 5.25% – 5.50% following a series of rapid increases initiated in March 2022. The persistence of higher-for-longer inflation is the primary culprit for the lack of Fed action so far this year, as they cannot risk a reacceleration of inflation should they decide to cut rates too soon. While their stated inflation target is 2%, there still may be room for rate cuts if the long-term inflation rate settles around 3%, but not as much as more speculative investment vehicles, that benefitted to a greater degree from near zero-percent interest rates during the 2010’s, are hoping for, and pricing in.
The narrow breadth and leadership of large-cap indexes continue to signal caution. As of this writing, six stocks comprise 31% of the S&P 500 and have accounted for about 65% of the index’s total return this year. There are some striking similarities to the “tech bubble” that peaked in early 2000, where the top ten stocks in the S&P 500 accounted for 27% of the index. The lack of breadth today is even more extreme. Interestingly, we note that Cisco’s 5-year annualized return of 105% from March 31, 1995, through March 31, 2000, is astonishingly like that of Nvidia’s 5-year total annualized return of 98% through June 30, 2024. As the tech bubble started to deflate late in 2000, Cisco would go on to fall (87%) over the next 30 months. This ushered in a difficult decade for growth stocks, where from 2000 to 2010, large-cap domestic growth stocks fell (33%) while other investments like bonds, small-cap stocks, and emerging markets outperformed.
While we don’t necessarily foresee a similar “crash” in technology stocks forthcoming, we question the impact that items such as the advent of passive investing and more quantitative-based trading models have had on the narrow breadth and leadership we currently see. These tools have led to higher correlations and lower dispersion in stocks with higher market capitalizations as broad-based flows move into and out of those names daily for little fundamental reason related to the specific group of stocks. Many investors who partake in this investing style may have little idea of the concentration risk they are taking, especially given that the benefits of such styles are pitched as diversification and risk mitigation tools. When combined with historical Fed intervention over the last fifteen years, we are unsure if the long-term effects and reverberations have yet to be fully realized.
The S&P 500 gained 4.3% in Q2 and 15.3% in the year’s first half, driven primarily by technology and AI narratives. While there certainly will be some long-term AI winners, for the market to be pricing in every large-cap stock that mentions AI in their press release as an emphatic AI winner seems disingenuous. When combined with a lack of breadth in the major indexes and compounding factors over time that drive runaway momentum, such as passive and quant-based investing, the result is the market we see today, where large-cap stocks are rising at an unabated rate with no concern for price discovery.
Performance Highlights
The Easterly Snow All Cap Value strategy performed slightly weaker in Q2 2024, underperforming its benchmark, the Russell 3000 Value Index. This underperformance was primarily driven by significant negative selection effects, with additional negative impact from allocation effects, reflecting a challenging quarter for the strategy.
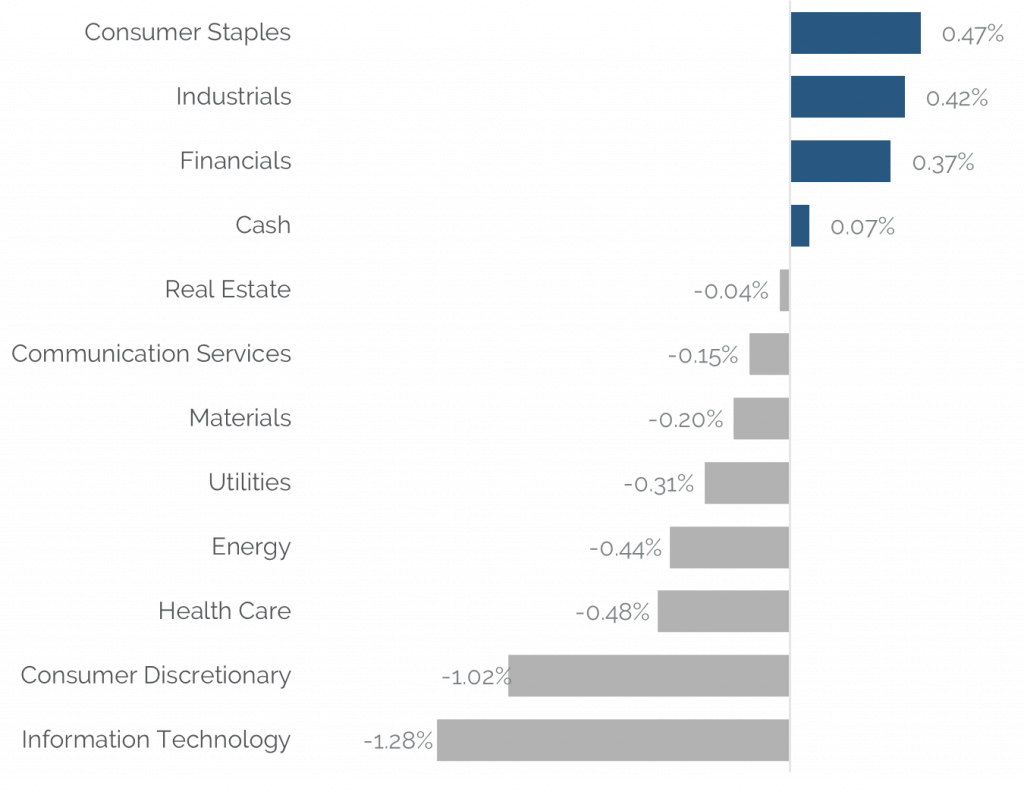
Sector contributions to the portfolio’s performance varied. Thanks to effective stock selection in consumer staples, industrials, and financials, positive contributions were observed in these sectors. In contrast, significant negative impacts came from Information Technology, Consumer Discretionary, and Health Care, where poor stock selection led to notable underperformance.
Portfolio Attribution
Top 5 Performance Contributors
| Stock | Avg Weight % | Contribution % |
|---|---|---|
| AMGEN INC | 3.53 | 0.37 |
| PILGRIM'S PRIDE CORP | 3.49 | 0.37 |
| ABM INDUSTRIES INC | 2.78 | 0.36 |
| CINEMARK HOLDINGS INC | 1.64 | 0.31 |
| ORACLE CORP | 2.39 | 0.30 |
Amgen Inc. (AMGN)
Amgen Inc. achieved a notable stock return of 10.68% in the second quarter of 2024, outperforming its Health Care sector peers. The company’s strong performance was driven by several key factors, including a positive earnings report with non-GAAP EPS of $3.96, beating estimates of $3.88. Revenue grew by 22%, bolstered by the acquisition of Horizon Therapeutics, contributing to double-digit revenue growth. Additionally, the interim analysis of Amgen’s obesity drug, MariTide, provided encouraging data, fueling investor optimism. The company also secured FDA approval for its lung cancer treatment, tarlatamab, further strengthening its oncology portfolio. With strong financial results and promising developments in its pipeline, Amgen remains well positioned for continued growth.
Pilgrim’s Pride (PPC)
Pilgrim’s Pride returned 12.15% in Q2 2024, outperforming the broader Consumer Staples sector. This strong performance can be attributed to solid financial results and strategic initiatives. The company reported first-quarter net sales of $4.4 billion and an operating income of $250.3 million, demonstrating robust revenue growth. Key drivers included an 18% year-over-year increase in net sales per pound and a strategic focus on customer relationships and supply chain improvements. PPC’s strong operational growth in the US, Europe, and Mexico contributed to its positive performance. The company’s brand-building and operational efficiency investments further supported this growth. With these factors, Pilgrim’s Pride has shown resilience and adaptability in a challenging market environment.
ABM Industries (ABM)
ABM Industries demonstrated impressive performance in the 2nd quarter of 2024, with a return of 13.91%, significantly outperforming the Industrials sector return of -5.04%. Key drivers included a revenue increase to $2.01 billion, beating estimates by 1.2%, and adjusted EPS of $0.87, exceeding expectations by $0.08. The company secured $1 billion in new business year-to-date, showcasing robust growth across all segments, particularly in Business & Industry and Technical Solutions. Additionally, ABM raised its full-year adjusted EPS guidance, citing continued top-line strength and new business momentum. The positive outlook, bolstered by solid demand in data centers and bundled energy solutions, underscores ABM’s strategic execution and market resilience.
Top 5 Performance Detractors
| Stock | Avg Weight % | Contribution % |
|---|---|---|
| BLOOMIN’ BRANDS INC | 2.99 | -1.12 |
| INTEL CORP | 1.50 | -0.87 |
| OPEN TEXT CORP | 3.12 | -0.73 |
| WALT DISNEY CO/THE | 3.16 | -0.66 |
| ZIMMER BIOMET HOLDINGS INC | 2.50 | -0.48 |
Bloomin’ Brands (BLMN)
Bloomin’ Brands underperformed in the first quarter of 2024, with a stock return of -32.26%. The company reported EPS of $0.70 on total revenue of $1.20 billion, both slightly below expectations. U.S. same-store sales were down 1.6%, with Outback Steakhouse reporting a 1.2% decline. Traffic dropped by 430 basis points, and restaurant-level operating margin fell to 16.0%, down 190 basis points year-over-year. Key events affecting performance included CEO David Deno’s retirement announcement and the exploration of strategic alternatives for the Brazil business, which contributed to investor uncertainty. These factors, along with increased labor costs and higher operational expenses, negatively impacted the stock’s performance.
Intel Corp (INTC)
Intel Corp underperformed significantly in the first quarter of 2024, with the stock down by 31.74%. Weaker-than-expected earnings and growing competitive pressures drove the decline. Intel reported a 32% drop in revenue to $918 million, a decline driven by lower volumes and inventory management actions, which hit demand. Additionally, Intel faced ongoing challenges in its data center business, where competition from AMD and Nvidia further eroded market share. The company’s decision to halt a $25 billion expansion project in Israel and increased legal concerns, including class action lawsuits, have also weighed heavily on investor sentiment.
Given the broken investment thesis and mounting concerns around Intel’s ability to compete effectively in a rapidly evolving market, we have decided to exit the position. Intel’s valuation no longer justifies the risks, particularly as it struggles to regain footing in the AI and data center markets. While management’s efforts to restructure and invest in AI may eventually yield results, the near-term outlook remains bleak. Exiting the position now allows us to limit further losses.
Open Text Corp (OTEX)
Open Text Corp experienced a significant decline of 21.98% in the second quarter of 2024, driven by disappointing financial results and a downgraded outlook. The stock sold off following the company’s FY3Q’24 results, where Open Text pushed its FY26 targets to FY27 and guided to lower adjusted EBITDA margins of 32-33%. The market responded negatively to the updated guidance, which included reduced revenue expectations for FY25, down to $5.745-$5.795 billion, and a 30% reduction in 2025 earnings estimates. Additionally, although cloud bookings grew 53% year-over-year, customers opted for longer contract durations, which delayed revenue realization. Despite a solid free cash flow of $348 million, the tempered outlook weighed heavily on the stock’s performance.
Source: SEI Global Services. as June 30, 2024
Securities shown represent the largest contributors and detractors to the portfolio’s performance for the period and do not represent all holdings within the portfolio. There is no guarantee that such holdings are currently or will remain in the portfolio. For a complete list of holdings and an explanation of the methodology employed to determine this information, please contact Easterly. This information is not to be construed as an offer to buy or sell any financial instrument nor does it constitute an offer or invitation to invest in any fund managed by Easterly and has not been prepared in connection with any such offer.
Trailing Performance
as of June 30, 2024
| QTD | YTD | 1 Yr | 3 Yr | 5 Yr | 7 Yr | 10 Yr | Since Inception* | |
|---|---|---|---|---|---|---|---|---|
| Composite (gross) | -4.77% | 5.21% | 13.28% | 6.25% | 12.12% | 9.77% | 6.83% | 9.53% |
| Composite (net) | -4.93% | 4.84% | 12.50% | 5.51% | 11.35% | 9.00% | 6.09% | 8.77% |
| Russell 3000 Value | -2.25% | 6.18% | 12.93% | 5.14% | 8.88% | 8.42% | 8.09% | 7.16% |
Calendar Year Performance
| 2023 | 2022 | 2021 | 2020 | 2019 | 2018 | 2017 | 2016 | 2015 | 2014 | |
|---|---|---|---|---|---|---|---|---|---|---|
| Composite (gross) | 16.08% | -5.75% | 28.03% | 10.25% | 26.52% | -18.39% | 14.46% | 16.73% | -12.36% | 8.17% |
| Composite (net) | 15.27% | -6.40% | 27.15% | 9.48% | 25.66% | -18.97% | 13.67% | 15.93% | -12.98% | 7.42% |
| Russell 3000 Value | 11.66% | -7.98% | 25.37% | 2.87% | 26.26% | -8.58% | 13.19% | 18.40% | -4.13% | 12.70% |
Source: SEI Global Services. as June 30, 2024
*Inception: 4/1/1998
Performance shown is the Easterly Investment Partners LLC (“the Firm”) Snow All Cap Value composite in USD. Past performance is not indicative of future results. Gross performance results do not include advisory fees and other expenses an investor may incur, which when deducted will reduce returns. Changes in exchange rates may have adverse effects. Net performance results reflect the application of a model investment management fee which is higher than the actual average weighted management fee charged to accounts in the composite applied to gross performance results. Actual fees may vary depending on, among other things, the applicable fee schedule and portfolio size. The Firm claims compliance with the GIPS® standards; this information is supplemental to the GIPS® report included in this material. Returns greater than one year are annualized.
Top 10 Holdings
| JPMORGAN CHASE & CO | 4.79% |
|---|---|
| LINCOLN NATIONAL CORP | 4.10% |
| SILICON MOTION TECHNOL-ADR | 3.75% |
| AMGEN INC | 3.74% |
| COMMERCIAL METALS CO | 3.43% |
| METLIFE INC | 3.35% |
| OPEN TEXT CORP | 3.21% |
| ABM INDUSTRIES INC | 3.03% |
| CNO FINANCIAL GROUP | 2.95% |
| BANK OF AMERICA CORP | 2.90% |
| Total | 35.25% |
Excludes cash and cash equivalents.
References to securities, transactions or holdings should not be considered a recommendation to purchase or sell a particular security and there is no assurance that, as of the date of publication, the securities remain in the portfolio. Additionally, it is noted that the securities or transactions referenced do not represent all of the securities purchased, sold or recommended during the period referenced and there is no guarantee as to the future profitability of the securities identified and discussed herein. Top ten holdings information shown combines share listings from the same issuer, and related depositary receipts, into a singular holding to accurately present aggregate economic interest in the referenced company.
Attribution vs Russell 3000 Value
Source: Bloomberg
Holdings, sector weightings, market capitalization and portfolio characteristics are subject to change at any time and are based on a representative portfolio, and may differ, sometimes significantly, from individual client portfolios.
Outlook
As active managers, we look forward to environments like this, where correlations are elevated, and stocks trade in step. This enables us to identify price dislocations and populate our strategy with great companies whose stock price doesn’t reflect their underlying fundamental valuation. This helps us drive positive returns over full cycles, not just on a day-to-day or quarter-to-quarter cadence.
The market continues to remain focused on the timing and magnitude of interest rate cuts from the Fed, which is looking more likely in the second half of the year even as they continue to reduce their own balance sheet (which stands in contrast to their balance sheet expansion during the 2010s, artificially suppressing yields). While certain pockets of the small-cap market may outperform (stocks with negative earnings and/or high debt levels) as rate cuts are initially priced in, we question how sustainable that outperformance may remain as the market prices in a normalized Fed Funds rate that may be higher than what those more speculative pockets of the market are hoping for.
As we work through a U.S. Presidential election cycle likely to bring volatility, items we’re paying heightened attention to include the U.S. jobs market, where unemployment has increased above 4%. The jobs market has shown impressive resilience, while other cracks in the U.S. economy have emerged over the last few quarters. Consumer spending, which is 70% of GDP, is declining as credit card balances continue to rise. Retail sales are slowing and, when factoring in inflation, have, in fact, turned negative. $1T in corporate debt annually continues to roll into issuances with much higher costs. We are unsure how this will impact more leveraged corporations, especially if cash flow falters. A housing market that looks increasingly unaffordable for many, especially younger people without familial financial assistance, may reshape how that younger cohort allocates their discretionary income. We are keeping a steady eye on the US fiscal deficit, the associated debt servicing costs, and the ramifications of legislators’ inability to rein in spending.
The Easterly Snow investment team’s core competency is to invest the same stylistically through all of this market noise. We remain focused on allocating capital to companies going through short-term difficulties with great balance sheets, material free cash flow, and a path to earnings recovery resulting in asymmetric upside/downside return profiles.
Easterly Investment Partners LLC Snow All Cap Value Composite GIPS® Report
Composite Inception Date: April 1, 1998
Composite Creation Date: 07/01/2021
| Composite Performance | Annualized 3-Year Standard Deviation | Total Asset (millions) | |||||||||
|---|---|---|---|---|---|---|---|---|---|---|---|
| Year End | Gross | Net | Russell 1000® Value | Composite | Russell 1000® Value | Composite Dispersion | Total Firm Assets | Firm (AUM) | Firm (AUA)* | Composite AUM | Number of Accounts |
| 2023 | 16.08% | 15.27% | 11.66% | 18.68% | 16.92% | 0.20% | 1,730 | 1,090 | 640 | 16 | 14 |
| 2022 | -5.75% | -6.40% | -7.98% | 25.15% | 21.84% | 0.39% | 1,834 | 1,341 | 493 | 24 | 21 |
| 2021 | 28.03% | 27.15% | 25.37% | 23.74% | 19.61% | 0.47% | 2718 | 1540 | 1178 | 29 | 22 |
| 2020 | 10.25% | 9.48% | 2.87% | 24.08% | 19.96% | 0.60% | - | - | 23 | 20 | |
| 2019 | 26.52% | 25.66% | 26.26% | 15.90% | 12.00% | 0.40% | - | - | 35 | 27 | |
| 2018 | -18.39% | -18.97% | -8.58% | 15.00% | 11.00% | 0.20% | - | - | 745 | 33 | |
| 2017 | 14.46% | 13.67% | 13.19% | 14.40% | 10.30% | 0.30% | - | - | 265 | 63 | |
| 2016 | 16.73% | 15.93% | 18.40% | 14.80% | 11.00% | 0.40% | - | - | 732 | 88 | |
| 2015 | -12.36% | -12.98% | -4.13% | 13.60% | 10.70% | 0.60% | - | - | 668 | 100 | |
| 2014 | 8.17% | 7.42% | 12.70% | 13.20% | 9.40% | 0.50% | - | - | 841 | 118 | |
*Firm-wide advisory-only assets. Assets under Advisement (AUA) includes the assets where Easterly Investment Partners (“Easterly”) provides its advisory services in similar strategies and does not have discretionary trading authority.
Firm Definition
For purposes of complying with the GIPS® standards, the firm is defined as Easterly Investment Partners LLC (“EIP”) which is an SEC registered investment adviser under the U.S. Investment Advisers Act of 1940, as amended, effective January 2019. The firm was redefined on 1/1/2023 to reflect that EIP is comprised of two distinct firms: the institutional asset management operations, investment strategies, performance track records, certain employees and client accounts of Levin Capital Strategies, which were acquired by EIP in March 2019, and Snow Capital Management LLC’s (“SCM”) asset management business, investment strategies, performance track records, client accounts, and certain employees, acquired by EIP in July 2021.
Firm Verification Statement
Easterly claims compliance with the Global Investment Performance Standards (GIPS®) and has prepared and presented this report in compliance with the GIPS standards. Easterly has been independently verified for the period April 1, 2019 through December 31, 2023. A firm that claims compliance with the GIPS standards must establish policies and procedures for complying with all the applicable requirements of the GIPS standards. Verification provides assurance on whether the firm’s policies and procedures related to composite and pooled fund maintenance, as well as the calculation, presentation, and distribution of performance, have been designed in compliance with the GIPS standards and have been implemented on a firm-wide basis.
Composite Verification Statement
The All Cap Value Composite has had a performance examination from composite inception date through December 31, 2023. The verification and performance examination reports are available upon request.
Composite Description
The All Cap Value composite provides exposure to long-only US publicly-traded equities, allocating capital based on the attractiveness of each asset class. The fully invested portfolio typically maintains 35 to 40 positions. No stock is allowed to exceed 10% of the portfolio’s market value and no industry can exceed 25%.
Benchmark Description
The Russell 3000® Value Total Return Index is composed of 3000 large U.S. companies, as determined by market capitalization. This portfolio of securities represents approximately 98% of the investable U.S. equity market. The Russell 3000® is comprised of stocks within the Russell 1000® and the Russell 2000® indices.The total return index is the price level index plus the dividend reinvested. Indexes are unmanaged. It is not possible to invest directly in an index.
The S&P 500 Index was retroactively removed as of 10/1/2022
Performance Calculation
All returns are calculated and presented in US dollars based on fully discretionary AUM, including those investors no longer with the firm. All gross composite returns are net of transaction costs and foreign withholding taxes, if any, and reflect the reinvestment of interest income and other earnings. Net performance results reflect the application of a model investment management fee which is higher than the actual average weighted management fee charged to accounts in the composite applied to gross performance results. Composite net returns are calculated by reducing daily gross returns by an amount where the monthly net return will be the monthly gross return reduced by 1/12th of the highest advisory fee rate. Monthly net returns are then geometrically linked to calculate the annual net return. Actual fees may vary depending on, among other things, the applicable fee schedule and portfolio size. Actual investment advisory fees incurred by clients will vary. Policies for valuing investments, calculating performance, and preparing GIPS reports are available upon request. A list of composite descriptions and a list of broad distribution pooled funds are available upon request. Past performance is not indicative of future performance. Results may be higher or lower based on IPO eligibility, and actual investor’s returns may differ, depending upon date(s) of investment(s). Additional information is available upon request. The All Cap Value Composite has removes accounts from the composite for the period of significant cash flow of greater than or equal to $20 million.
Investment Management Fee Schedule
The current standard management fee schedule for a segregated account managed to the composite strategy is as follows: 0.70% on assets.
Composite Dispersion
The annual composite dispersion, if shown, is an asset-weighted standard deviation calculated using gross returns for the accounts in the composite the entire year. The internal dispersion measure is not applicable if there are five or fewer portfolios in the composite for the entire year if that is the reason this is N/A.
Standard Deviation
The annualized 3-year standard deviation represents the annualized standard deviation of actual gross composite and benchmark returns, using the rolling 36 months ended each year end. Standard deviation is a measurement of historical volatility of investment returns.
Trademark
GIPS® is a registered trademark of CFA Institute. CFA Institute does not endorse or promote this organization, nor does it warrant the accuracy or quality of the content contained herein.
Important Disclosures
© 2024. Easterly Asset Management. All rights reserved.
Easterly Asset Management’s advisory affiliates (collectively, “EAM” or “the Firm”), including Easterly Investment Partners LLC, Easterly Funds LLC, and Easterly EAB Risk Solutions LLC (“Easterly EAB”) are registered with the SEC as investment advisers under the Investment Advisers Act of 1940, as amended. Registration does not imply a certain level of skill or training. More information about the firm, including its investment strategies and objectives, can be found in each affiliate’s Form ADV Part 2 which is available on the www.sec.gov website. This information has been prepared solely for the use of the intended recipients; it may not be reproduced or disseminated, in whole or in part, without the prior written consent of EAM.
No funds or investment services described herein are offered or will be sold in any jurisdiction in which such an offer or sale would be unlawful under the laws of such jurisdiction. No such fund or service is offered or will be sold in any jurisdiction in which registration, licensing, qualification, filing or notification would be required unless such registration, license, qualification, filing, or notification has been affected.
The material contains information regarding the investment approach described herein and is not a complete description of the investment objectives, risks, policies, guidelines or portfolio management and research that supports this investment approach. Any decision to engage the Firm should be based upon a review of the terms of the prospectus, offering documents or investment management agreement, as applicable, and the specific investment objectives, policies and guidelines that apply under the terms of such agreement. There is no guarantee investment objectives will be met. The investment process may change over time. The characteristics set forth are intended as a general illustration of some of the criteria the strategy team considers in selecting securities for client portfolios. Client portfolios are managed according to mutually agreed upon investment guidelines. No investment strategy or risk management techniques can guarantee returns or eliminate risk in any market environment. All information in this communication has been obtained from sources believed to be reliable but cannot be guaranteed. Investment products are not FDIC insured and may lose value.
Investments are subject to market risk, including the loss of principal. Nothing in this material constitutes investment, legal, accounting or tax advice, or a representation that any investment or strategy is suitable or appropriate. The information contained herein does not consider any investor’s investment objectives, particular needs, or financial situation and the investment strategies described may not be suitable for all investors. Individual investment decisions should be discussed with a personal financial advisor.
Any opinions, projections and estimates constitute the judgment of the portfolio managers as of the date of this material, may not align with the Firm’s opinion or trading strategies, and may differ from other research analysts’ opinions and investment outlook. The information herein is subject to change without notice and may be superseded by subsequent market events or for other reasons. EAM assumes no obligation to update the information herein.
References to securities, transactions or holdings should not be considered a recommendation to purchase or sell a particular security and there is no assurance that, as of the date of publication, the securities remain in the portfolio. Additionally, it is noted that the securities or transactions referenced do not represent all of the securities purchased, sold or recommended during the period referenced and there is no guarantee as to the future profitability of the securities identified and discussed herein. As a reminder, investment return and principal value will fluctuate.
The indices cited are, generally, widely accepted benchmarks for investment performance within their relevant regions, sectors or asset classes, and represent non managed investment portfolio. It is not possible to invest directly in an index.
This communication may contain forward-looking statements, which reflect the views of EAM and/or its affiliates. These forward-looking statements can be identified by reference to words such as “believe”, “expect”, “potential”, “continue”, “may”, “will”, “should”, “seek”, “approximately”, “predict”, “intend”, “plan”, “estimate”, “anticipate” or other comparable words. These forward-looking statements or other predications or assumptions are subject to various risks, uncertainties, and assumptions. Accordingly, there are or will be important factors that could cause actual outcomes or results to differ materially from those indicated in these statements. Should any assumptions underlying the forward-looking statements contained herein prove to be incorrect, the actual outcome or results may differ materially from outcomes or results projected in these statements. EAM does not undertake any obligation to update or review any forward-looking statement, whether as a result of new information, future developments or otherwise, except as required by applicable law or regulation.
Past performance is no guarantee of future results.
20240905-3827777