Market Summary
While the broad markets were extremely volatile during 2022, with multiple mini rallies but ultimately finishing down for the year, major indexes posted solid positive results for the fourth quarter. Better than expected corporate earnings reports, a pullback in commodity prices and cooling inflation data fueled the market’s appetite for capital assets.
The S&P 500 declined -18.1% in 2022, after gaining 7.6% in the 4th quarter. The Russell 3000 Value declined only -8.0% during the year, increasing over 12% during the final three months. Only a monthly basis, Value indexes outperformed Growth fairly consistently over the course of the year, with the Russell 3000 Growth ultimately falling -29.0% in 2022.
During the most recent Federal Reserve Board meeting, the central bank raised its benchmark interest rate by 0.5%, taking it to a target range of 4.25% to 4.50%. The half-point increase follows four consecutive hikes of 0.75%. The Fed slightly eased the pace of tightening as it balances the need to tame soaring consumer prices in an effort to prevent the economy from falling into a recession. After a difficult two years, inflation does appear to be loosening its grip on the economy, which is encouraging. Overall, the Consumer Price Index increased by a mere 0.1% in November, with the annual rate falling from 7.7% to 7.1%. Meanwhile, the unemployment rate held steady at 3.7%, remaining historically low; however, layoffs are on the rise and we expect the trend to continue.
Many businesses have announced plans to reduce staff including Meta, Cisco, Amazon, Salesforce, Twitter, Morgan Stanley and Goldman Sachs, mostly due to adjustments in business plans as they overstaffed during the pandemic.
Performance Highlights
The Snow Focused Value strategy outpaced the benchmark by 98 basis points during the quarter, returning 13.40% gross of fees (13.14% net of fees), while the Russell 1000 Value index gained 12.42%. For the year, the strategy outperformed by 643 basis points, returning -1.11% gross of fees (-2.04% net of fees), as the Russell 1000 Value declined -7.54%.
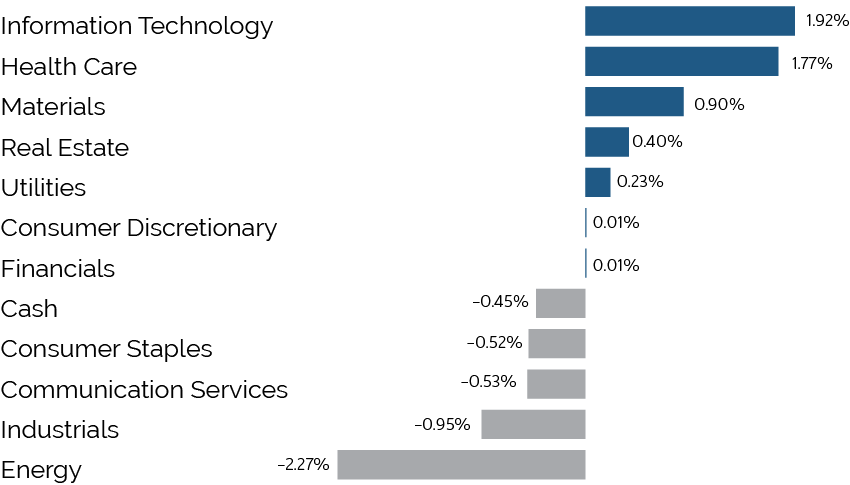
The Snow Focused Value strategy’s relative performance can be attributed to both positive stock selection and sector positioning. Stock selection in Information Technology, Health Care and Materials lead the way, while selection within Energy was the largest detractor from relative performance. The portfolio benefitted from its overweight to Energy, along with not holding any Real Estate or Utilities.
Portfolio Attribution
Top 5 Performance Contributors
| Stock | Avg Weight % | Contribution % |
|---|---|---|
| Super Micro Computer | 4.14 | 1.64 |
| Freeport-McMoran | 4.90 | 0.28 |
| PVH | 3.43 | 1.48 |
| Amgen | 2.07 | 1.39 |
| JPMorgan Chase | 5.17 | 1.36 |
Super Micro Computer (SMCI)
Shares of SMCI appreciated during the quarter as the company issued an upbeat earnings report and forecast. The company continues to execute on growth initiatives and is taking share in the server market. Despite the rise in the stock, we believe the stock remains significantly undervalued, trading for approximately 9x forward earnings estimates.
Freeport-McMoRan (FCX)
FCX shares benefitted from a recovery of global copper prices and continued strong performance from the company’s operating copper and gold mines. While copper prices have been volatile, the metal is expected to play a pivotal role in decarbonization efforts. FCX offers investors a stable production profile from favorable jurisdictions, with an asset base that can increase production when prices support investment.
PVH (PVH)
PVH shares contributed to performance after reporting a resilient third quarter result, with particularly impressive sales momentum in Asia and Europe. While PVH is not immune to the weakening macro backdrop, the company outperformed in the quarter from several company specific initiatives and a weakening USD. The company has a large share repurchase authorization, a clean balance sheet and is trading for approximately 8x our normalized estimate.
Top 5 Performance Detractors
| Stock | Avg Weight % | Contribution % |
|---|---|---|
| Lincoln National | 0.90 | -0.70 |
| Walt Disney | 3.68 | -0.69 |
| Southwestern Energy | 1.69 | -0.59 |
| Hasbro | 2.46 | -0.48 |
| Kohl's | 2.23 | -0.13 |
Lincoln National (LNC)
LNC underperformed during the quarter after the company announced weaker results, which were impacted by a reserve charge to their life insurance business. LNC management has taken appropriate action to improve reserves and continue to focus on earnings growth. The valuation has become more attractive given the stock weakness and the limited impact on earnings.
Walt Disney (DIS)
DIS shares declined during a tumultuous quarter for the company, which included the return of former CEO Bob Iger, retaking his old role and replacing sitting CEO Bob Chapek. Iger will immediately be tasked with steadying the direct-to-consumer business, which includes Disney+, ESPN+, and Hulu, where costs and operating losses continue to build as the company works to build the platform out globally, while also assuaging consumers who feel prices at the company’s parks business have run too high. We have maintained a position in the name given the strength of the brand and potential value to be unlocked from the company’s suite of entertainment offerings.
Southwestern Energy (SWN)
Shares of natural gas producer SWN underperformed after being added to the portfolio in mid-November. Near-term commodity prices weakened following the extended shutdown of the Freeport LNG export facility. Natural gas storage levels have grinded higher than expected but remain well below 5-year averages. We believe SWN remains deeply undervalued; the company is actively reducing debt and has a large share repurchase authorization.
Trailing Performance
*As of December 31, 2022
| QTD | 1 Yr | 3 Yr | 5 Yr | 7 Yr | 10 Yr | Since Inception** | |
|---|---|---|---|---|---|---|---|
| Composite (Gross) | 13.40% | -1.11% | 10.15% | 7.00% | 9.61% | 10.40% | 13.93% |
| Composite (Net) | 13.14% | -2.04% | 9.11% | 5.99% | 8.58% | 9.36% | 12.86% |
| Russell 1000 Value | 12.42% | -7.54% | 5.95% | 6.66% | 9.11% | 10.29% | 11.19% |
Calendar Year Performance
| 2022 | 2021 | 2020 | 2019 | 2018 | 2017 | 2016 | 2015 | 2014 | 2013 | |
|---|---|---|---|---|---|---|---|---|---|---|
| Composite (Gross) | -1.11% | 31.80% | 2.56% | 28.00% | -18.03% | 17.76% | 15.10% | -18.20% | 15.17% | 50.18% |
| Composite (Net) | -2.04% | 30.57% | 1.59% | 26.81% | -18.81% | 16.66% | 14.03% | -18.99% | 14.10% | 48.81% |
| Russell 1000 Value² | -7.54% | 25.16% | 2.80% | 26.54% | -8.27% | 13.66% | 17.34% | -3.83% | 13.45% | 32.53% |
Source: SEI Global Services
* Returns for periods greater than a year are annualized. Past performance is not indicative of future results.
** Inception: 12/31/08
Top 10 Holdings
| Freeport-McMoran | 5.52% |
| JPMorgan Chase | 5.26% |
| Centene | 5.21% |
| Hartford Financial Services | 4.98% |
| WESCO International | 4.87% |
| MetLife | 4.81% |
| Zimmer Biomet Holdings | 4.52% |
| PVH | 4.40% |
| Super Micro Computer | 4.29% |
| Walt Disney | 4.22% |
| Total | 48.08% |
|---|
Total Effect Attribution vs Russell 1000 Value
Outlook
As we have discussed in the past, we believe the economy is in a period of higher structural inflation and we expect it to remain above its long-term average. This environment bodes well for the value style given its historical correlations with increasing interest rates and rising inflation. Furthermore, from a growth and value index construct perspective, the largest relative sector weights in the value index are Financials and Energy, both of which are poised to perform well going forward.
Disinflation and global economic desynchronization will be the dominant macro themes for 2023. With fears of a recession looming and the central bank in an aggressive tightening cycle, the path for a soft landing is narrowing. Variables including employment, interest rates and consumer price index reports will likely keep volatility levels elevated and pressure on capital asset prices. In our view, given the array of macroeconomic headwinds, the direction of equity prices will be more modest and driven by idiosyncratic reasons.
The consistent application of our investment approach has led to strong performance over all types of market environments. In turn, we continue to hold companies with compelling business fundamentals, skilled management teams, reoccurring cash flows and the flexibility to adapt to an inflationary environment.
We believe the strong cash flow generation and capital flexibility of our businesses will provide meaningful protection if market fundamentals deteriorate. Our portfolio of stocks is significantly discounted based on relative multiple valuations, compared to its benchmark. We remain dedicated to delivering strong long-term performance and transparent communications to our investors. As always, we welcome your comments and questions. Thank you for your commitment to Easterly Investment Partners.
Disclosures
Easterly Investment Partners (EIP) is a registered investment adviser. Registration of an Investment Advisor does not imply any level of skill or training. This composite has been assigned to Easterly Investment Partners (EIP) effective July 1, 2021. Performance presented prior to July 1, 2021, occurred while the Portfolio Manager(s) and the research team were affiliated with a prior firm (Snow Capital Management, L.P.). EIP claims compliance with the Global Investment Performance Standards (GIPS®). A fully compliant GIPS presentation along with a complete list and description of all composites is available upon request. The Focused Value composite contains fully discretionary accounts consisting of an equity portfolio of less than 25 stocks that invests at least 80% of assets in companies with market capitalizations greater than $1 billion and dates back to December 31, 2008. This composite has no minimum requirement and for comparison purposes is measured against the Russell 1000 Value. The U.S. Dollar is the currency used to express performance. Leverage is not used in this composite. Investing involves risk; clients may experience a profit or a loss. Past performance is not indicative of future results. Performance is preliminary. Composite returns are shown gross of fees and do not reflect the deduction of advisory fees. Actual returns are shown gross of fees and do not reflect the deduction of advisory fees. Actual returns will be reduced by advisory fees and other expenses incurred in the management of the account. EIP’s advisory fees are outlined in our Form ADV Part 2A (Brochure), which is available upon request. The effect of an advisory fee compounded over a period of years, on the total value of a client’s portfolio is represented by the following example. Assuming an initial portfolio of $1 million earning a 10% return each year which incurs an annual advisory fee of 1.0% payable quarterly in advance, the portfolio would be worth $1.53 million net of fees and $1.61 million gross of fees after 5 years, $2.37 million net of fees and $2.59 million gross of fees after 10 years and $3.58 million net of fees and $4.15 million gross of fees after 15 years. Past performance is not guarantee of future results. The performance of any individual portfolio may vary from the Composite’s performance.
The performance figures are based on a composite of many accounts and not all accounts owned the securities mentioned in this commentary. Holdings and sector allocations are subject to change. The latest copy of our Form ADV Part 2A (Brochure) and a complete list and description of EIP’s composites and/or a presentation that adheres to the Global Investment Performance Standards (GIPS®) is available upon request.
Russell 1000® Value Index
The Russell 1000 Value Index measures the performance of the large-cap value segment of the U.S. equity universe. It includes those Russell 1000 companies with lower price-to-book ratios and lower expected growth values. Indexes are unmanaged. It is not possible to invest directly in an index.