Market Summary
While the broad markets were extremely volatile during 2022, with multiple mini rallies but ultimately finishing down for the year, major indexes posted solid positive results for the fourth quarter. Better than expected corporate earnings reports, a pullback in commodity prices and cooling inflation data fueled the market’s appetite for capital assets.
The S&P 500 declined -18.1% in 2022, after gaining 7.6% in the 4th quarter. The Russell 3000 Value declined only -8.0% during the year, increasing over 12% during the final three months. Only a monthly basis, Value indexes outperformed Growth fairly consistently over the course of the year, with the Russell 3000 Growth ultimately falling -29.0% in 2022.
During the most recent Federal Reserve Board meeting, the central bank raised its benchmark interest rate by 0.5%, taking it to a target range of 4.25% to 4.50%. The half-point increase follows four consecutive hikes of 0.75%. The Fed slightly eased the pace of tightening as it balances the need to tame soaring consumer prices in an effort to prevent the economy from falling into a recession. After a difficult two years, inflation does appear to be loosening its grip on the economy, which is encouraging. Overall, the Consumer Price Index increased by a mere 0.1% in November, with the annual rate falling from 7.7% to 7.1%. Meanwhile, the unemployment rate held steady at 3.7%, remaining historically low; however, layoffs are on the rise and we expect the trend to continue.
Many businesses have announced plans to reduce staff including Meta, Cisco, Amazon, Salesforce, Twitter, Morgan Stanley and Goldman Sachs, mostly due to adjustments in business plans as they overstaffed during the pandemic.
Performance Highlights
The Large Cap Value strategy outpaced the benchmark by 216 basis points during the quarter, rallying 14.58% gross of fees (14.46% net of fees), while the Russell 1000 Value index gained 12.42%. For the year, the strategy outperformed the benchmark by 441 basis points, returning -3.12% gross of fees (-3.54% net of fees), while the Russell 1000 Value index declined -7.54%.
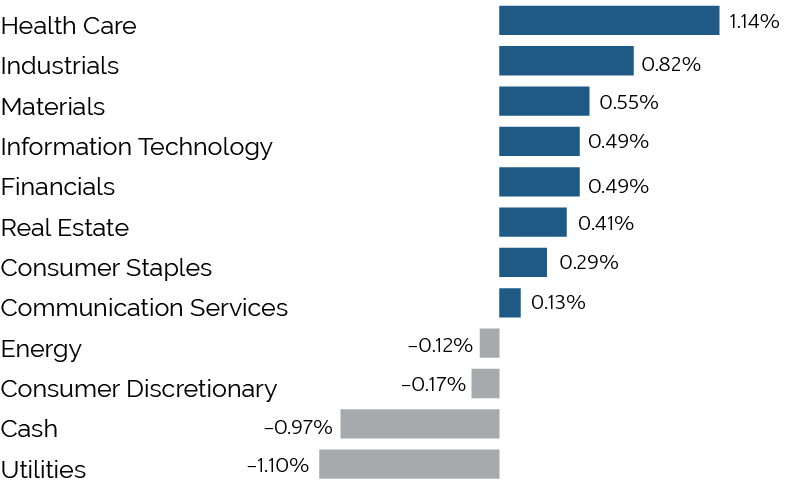
The Large Cap Value strategy’s strong relative performance for the quarter was driven by strong stock selection, but sector positioning positively contributed to relative performance as well. Stock selection within Health Care, Industrials, and Materials added the most relative value, while selection within Utilities detracted from performance. From a sector positioning standpoint, the portfolio’s underweight stance in both Real Estate and Communication Services added the most value.
Portfolio Attribution
Top 5 Performance Contributors
| Stock | Avg Weight % | Contribution % |
|---|---|---|
| Viatris | 4.17 | 1.21 |
| American International Group | 4.02 | 1.16 |
| Merck | 3.38 | 1.16 |
| DuPont de Nemours | 2.99 | 1.11 |
| Goldman Sachs Group | 4.66 | 0.99 |
Viatris (VTRS)
VTRS shares rose after the company posted strong Q3 results and updated their long-term financial targets. VTRS completed the sale of its biologics business and intends to use part of the proceeds to paydown debt and initiate a share repurchase program in 2023. In addition, the company announced two ophthalmology-related acquisitions for a combined purchase price of approximately $750 million and will establish a new Viatris Eye Care Division. The acquisitions are expected to close during Q1 2023. We expect more information on the previously announced $6 billion of potential divestitures in the coming months.
American International Group (AIG)
AIG gained during the quarter as they reported a strong Q3 print, driven by better results in Property & Casualty. AIG’s Combined Ratio came in better than expected and it posted another positive reserve development, further evidence that work to de-risk and re-price its book of business is bearing fruit. Their Life & Retirement results were largely in-line as well. We continue to like AIG and expect it to repurchase $15 billion of stock over the next two years, largely funded by continued public offerings of its life business, Corebridge Financial.
Merck (MRK)
MRK rallied after Q3 results came in ahead of expectations. Sales of key drugs Keytruda, Gardasil and Januvia were all better than expected. Improved gross margin and lower SG&A resulted in an EPS beat. MRK narrowed their fiscal year sales guidance but slightly raised their EPS. We continue to be impressed by the Keytruda franchise with sales +26% YTD.
New Keytruda indications are particularly impressive and will help alleviate a sales cliff following Keytruda’s loss of exclusivity later this decade. We continue to see upside in the stock, but have dialed back the position in recent weeks.
Top 5 Performance Detractors
| Stock | Avg Weight % | Contribution % |
|---|---|---|
| Dominion Energy | 5.22 | -0.58 |
| Vodafone | 2.59 | -0.18 |
| Taiwan Semiconductor | 0.58 | -0.10 |
| Mattel | 0.45 | -0.08 |
| Chesapeake Energy | 1.36 | -0.06 |
Dominion Energy (D)
D launched a strategic review during the quarter, due to underperformance and to manage through the Virginia Clean Economy Act, which could drive multiyear regulated growth. We anticipate that any businesses Dominion would divest would trade at a discount to their valuation but D trades at a large discount to the rest of their peers and theoretically any divesture will be good for D’s multiple. Many avoid investing in utilities undergoing structural change, but if D divests its non-regulated business, reaffirms EPS and better defines their dividend policy, the street view on the stock will improve.
Vodafone (VOD)
VOD shares declined after the company reported earnings, which included a miss on EBITDAAL and a guide to the low end of their 2023 range. VOD continues to have an attractive dividend yield and we expect them to move forward with further strategic initiatives with their portfolio.
Taiwan Semiconductor (TSM)
TSM was a new addition to the portfolio during the quarter and declined slightly due to the geopolitical risk with China. TSM is the leading semiconductor fabrication company in the world. We believe their earnings are bottoming and the company should benefit from the global supply chain straightening out.
Trailing Performance
*As of December 31, 2022
| QTD | 1 Yr | 3 Yr | 5 Yr | 7 Yr | 10 Yr | Since Inception** | |
|---|---|---|---|---|---|---|---|
| Composite (Gross) | 14.58% | -3.12% | 9.00% | 6.35% | 9.26% | 11.36% | 8.71% |
| Composite (Net) | 14.46% | -3.54% | 8.52% | 5.88% | 8.77% | 10.86% | 8.22% |
| Russell 1000 Value | 12.42% | -7.54% | 5.95% | 6.66% | 9.11% | 10.29% | 6.49% |
Calendar Year Performance
| 2022 | 2021 | 2020 | 2019 | 2018 | 2017 | 2016 | 2015 | 2014 | 2013 | |
|---|---|---|---|---|---|---|---|---|---|---|
| Composite (Gross) | -3.12% | 23.72% | 8.07% | 14.44% | -8.18% | 14.62% | 19.18% | 2.72% | 13.30% | 35.62% |
| Composite (Net) | -3.54% | 23.18% | 7.57% | 13.93% | -8.60% | 14.11% | 18.66% | 2.26% | 12.79% | 35.03% |
| Russell 1000 Value | -7.54% | 25.16% | 2.80% | 26.54% | -8.27% | 13.66% | 17.34% | -3.83% | 13.45% | 32.53% |
Source: SEI Global Services
* Returns for periods greater than a year are annualized. Past performance is not indicative of future results.
* * Inception: 1/1/07
Top 10 Holdings
| Bio-Rad Laboratories | 5.35% |
| Dominion Energy | 5.20% |
| Truist Financial | 5.16% |
| Viatris | 4.93% |
| Goldman Sachs Group | 4.29% |
| Unilever | 4.21% |
| Cisco Systems | 3.89% |
| American International Group | 3.74% |
| Nvent Electric | 3.73% |
| Hess | 3.57% |
| Total | 44.06% |
|---|
Total Effect Attribution vs Russell 1000 Value
Outlook
As we have discussed in the past, we believe the economy is in a period of higher structural inflation and we expect it to remain above its long-term average. This environment bodes well for the value style given its historical correlations with increasing interest rates and rising inflation. Furthermore, from a growth and value index construct perspective, the largest relative sector weights in the value index are Financials and Energy, both of which are poised to perform well going forward.
Disinflation and global economic desynchronization will be the dominant macro themes for 2023. With fears of a recession looming and the central bank in an aggressive tightening cycle, the path for a soft landing is narrowing. Variables including employment, interest rates and consumer price index reports will likely keep volatility levels elevated and pressure on capital asset prices. In our view, given the array of macroeconomic headwinds, the direction of equity prices will be more modest and driven by idiosyncratic reasons.
Volatile markets where prices are driven by idiosyncratic stories present immense opportunity for fundamental investors like ourselves. Our bottom-up research process allows us to identify contrarian, value stocks with company specific catalysts that will lead to price appreciation.
We continue to turn the portfolio over as stocks reach their price target, have their catalyst have play out, or to make space for a better idea. We invite you all to join our new idea generation meetings to hear about the opportunities we are currently seeing. We remain dedicated to delivering strong long-term performance and transparent communications to our investors. As always, we welcome your comments and questions. Thank you for your commitment to Easterly Investment Partners.
Disclosures
The information provided in this report should not be considered a recommendation or solicitation to purchase or sell any particular security or investment strategy. There is no assurance that any securities discussed herein will remain in an account’s portfolio at the time you receive this report or that securities sold have not been repurchased. The securities discussed do not represent an account’s entire portfolio and, in the aggregate, may represent only a small percentage of an account’s portfolio holdings. It should not be assumed that any of the securities transactions or holdings discussed was or will prove to be profitable, or that the investment recommendations or decisions the subadvisor makes in the future will be profitable or will equal the investment performance of the securities discussed herein. As a reminder investment return and principal value will fluctuate.
All information in this presentation has been obtained from sources believed to be reliable but cannot be guaranteed. There can be no assurance that the investment objective for this fund can be achieved and past performance is no guarantee of future results. The Russell 1000 Value Index® is a benchmark of unmanaged securities, and the index is not a security that can be purchased or sold.
Easterly Investment Partners LLC is an investment adviser registered with the SEC. Registration does not imply a certain level of skill or training.
This communication also contains forward-looking statements, which reflect the views of Easterly Investment Partners LLC. These forward-looking statements can be identified by reference to words such as “believe”, “expect”, “potential”, “continue”, “may”, “will”, “should”, “seek”, “approximately”, “predict”, “intend”, “plan”, “estimate”, “anticipate” or other comparable words. These forward-looking statements are subject to various risks, uncertainties and assumptions. Accordingly, there are or will be important factors that could cause actual outcomes or results to differ materially from those indicated in these statements. Should any assumptions underlying the forward-looking statements contained herein prove to be incorrect, the actual outcome or results may differ materially from outcomes or results projected in these statements. Easterly Investment Partners LLC and its affiliates do not undertake any obligation to update or review any forward-looking statement, whether as a result of new information, future developments or otherwise, except as required by applicable law or regulation.