Executive Summary
This paper is an analysis of equity volatility and its impact on portfolio correlation and diversification. By examining a standard institutional asset allocation against a Hedged Equity approach, our research has found that correlation management is key to accessing the benefits of diversification. By analyzing volatility regimes and their impact on correlations to equity (S&P 500), we observed how asset allocation can improve by focusing on moments of volatility and equity vulnerability. We chose a representative institutional asset allocation portfolio, the “Institutional Portfolio (IP)” (see Appendix) for comparison against both the S&P 500 and our Hedged Equity strategy during periods characterized by extreme volatility. Through statistical analysis, we show the beneficial impact of reduced downside correlation with our Hedged Equity strategy when compared to the increased equity correlation in the Institutional Portfolio. This provides specific insight into why accepted diversification concepts may fail during times of market stress. Past bull markets may give way to more prevalent bear markets as concerns about equity valuations, inflation and less stimulative FED policy arise. In that case, traditional diversified portfolios could exhibit a higher probability of failure. As we demonstrate, there are significant advantages to allocating to equity correlation-reducing strategies, like Hedged Equity.
Background
The idea that muting volatility has value in portfolio management garnered attention after the dot.com bubble of 2000, and then became popular as an investment category after the Global Financial Crisis. Those strategies that focus exclusively on dampening volatility have the tendency to fail under the stress of the high volatility of deeper decline moves and have often found it difficult to show the benefits of volatility minimization as investors experience somewhat symmetric upside to downside capture ratios. However, if equity volatility/correlation risk could be reduced at its simplest level, an investor could keep overall portfolio Beta reasonable and directly manage the long-term portfolio drag from deep losses. This would improve portfolio Sharpe ratios and strengthen adherence to long term asset allocation objectives, allowing for increased allocation to lower-liquidity and higher risk segments.
The two main approaches of volatility management are:
- Derivatives-based approach – premium selling and/or buying; and
- Underlying factor security selection-based approach
These approaches have frequently reduced downside risk but at the expense of lower upside capture. More importantly, because they focus exclusively on volatility minimization and fail to incorporate correlation management, a key feature of our Hedged Equity strategy, these approaches can underperform precisely when they need to add value.
There have been three-month periods (or longer) of significant outperformance for Hedged Equity versus the S&P 500 and the Institutional Portfolio on a risk adjusted basis, with significant insight to be gained from these periods. As seen in Figure 1, the correlation of diversified portfolios, such as the IP to the S&P 500, often have greater correlation than their allocation to equity would infer and exhibit increased correlation when the S&P 500 declines. Hedged Equity’s realized correlation performs quite differently in these environments where the value of variable correlation (i.e., lower decline and a quicker to recovery characteristic), becomes apparent.
Figure 1
Correlation is Important But Rarely Stable
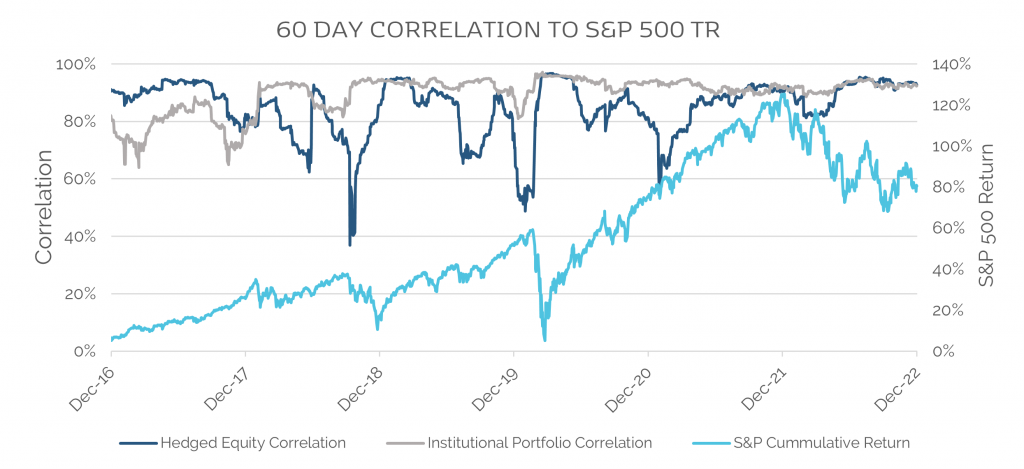
Source: Easterly EAB. Publicly available net-of-fees mutual fund and index data.
It’s also important to recognize that most asset allocation construction is based on long term average returns, volatility, and correlation forecasts. Because of the impact of extreme volatility on correlations, the actual performance of asset allocation/diversification can significantly differ from the expected performance. As a result, the optimization of diversification using historical averages falls short of its goal. Therefore, we have identified the characteristics in moments of extreme volatility that need to be addressed to optimize diversification. We performed a regression analysis of the VIX against the S&P 500 to better understand the relationship of volatility to S&P 500 price levels. (Figure 2). Interestingly, our results show that the VIX itself did not provide any meaningful signal for S&P 500 values or direction, meaning that with the VIX between 15 and 30 the S&P 500 could be could be positive or negative on a daily basis. This is very important as it challenges the idea that traditional volatility minimization has a repeatable information ratio. Volatility management is important, but to find the real story and see through the noise in the relationship between the VIX and S&P 500 a regime analysis must be done. Because much of the volatility and equity correlation data is noise within normal ranges of volatility, they can mask the value of the more extreme periods.
Figure 2
Vix Levels vs. SPX Slope1
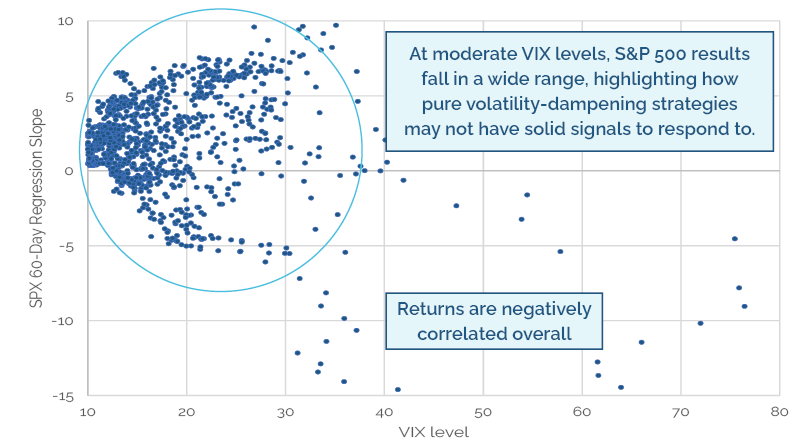
1 The SPX slope is a lagged linear regression over the 60 trailing 60-day timeframe. The slope is the best fit through the 60-day period minimizing the RMSE. The slope in the linear regression is used to represent the long-term trend in the SPX.
While one may think these extreme periods are only tail events, they are not. We show that over the last five-plus years there have been six such events (see shaded areas in Figure 3). When volatility moves outside of normal ranges, there is a tendency for the impact on security, sector, and asset class correlations to create unpredictable performance. In analyzing efficient portfolio diversifying approaches, we examine the periods most likely to create disruptive performance. We believe any approach not considering that tendency will lead to poor diversification performance. Post-mortem analysis of significant events and diversification failures often attribute these asset allocation and/or manager failures to unpredictable and idiosyncratic results. Furthermore, we believe it is possible that diversification and manager failures in these moments may be due to an inability to manage Beta expansion of extraordinary correlation moves that take place in extreme volatility regimes. As Figure 3 highlights, with spiking levels of volatility, equity returns often turn negative. Due to the tendency of high volatility environments to increase Beta, these are the moments of diversification risk that must be addressed to preserve portfolio value. As a result, decreasing correlation to equity in those moments is a vital component of effective asset allocation. In essence, a broad reduction of Beta can prove to be inefficient relative to a managed reduction during stress events.
Figure 3
Volatilty Regime Discovery Analysis2
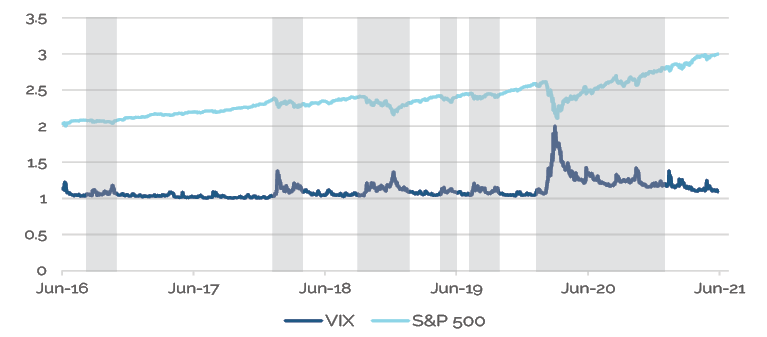
2 The regime identification is based on Changepoint detection algorithms for VIX. We employ Gaussian Kernel (radial basis functions) similar to Killick, R., Fearnhead, P., & Eckley, I. (2012). Optimal detection of changepoints with a linear computational cost. Journal of the American Statistical Association, 107(500), 1590–1598.
As correlations between Hedged Equity and S&P 500 decrease, there is a clear increase in correlations between the IP and S&P 500, revealing a consistent pattern of return degradation for the IP portfolio (see Figure 4). The data shows that during periods of extreme volatility, the diversification provided by the IP does not meaningfully reduce correlation to S&P 500. The Hedged Equity correlation, in contrast, begins to drop at lower levels of decline (between -2% and -7%) and provides a different return profile than the S&P 500 or the IP.
Figure 4
Hedged Equity Correlation in Down Markets
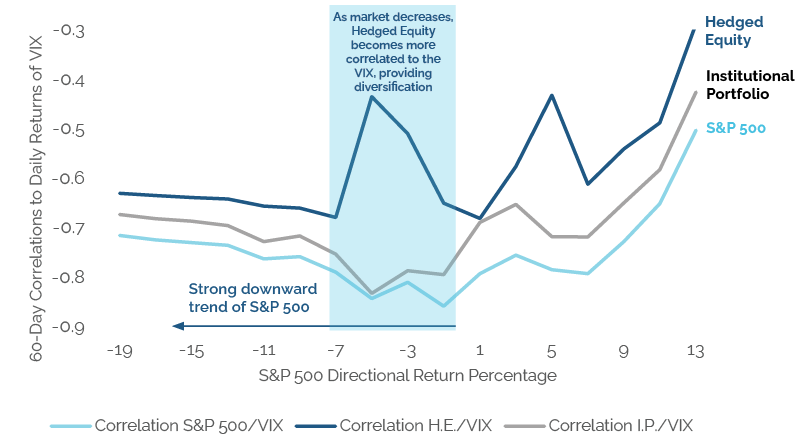
Another important feature of these drawdowns has been the potential of a change in risk premia post-event because market participants demand higher returns for the new information in the market. As the Hedged Equity approach uses volatility as one of its inputs, it responds well to moments of stress and residually high post-event volatility and correlation. It collects higher volatility premiums from its call sales, but also maintains its managed correlation versus the S&P 500.That contrasts with the IP, which suffers higher-return premiums and remains highly correlated. From the chart above (Figure 4) one can see that as the S&P 500 moves into negative territory, Hedged Equity starts to correlate to the VIX, benefitting from the rise in volatility, whereas the S&P 500 and the IP decline. This highlights how the diversification value of the IP is reduced. In the most prevalent zone of S&P 500 declines, in the -2 to -7% range, the Hedged Equity correlation increases to the VIX, which is distinguished from that of the IP and S&P 500, which do not benefit from volatility correlation. Even in deeper declines the hedged equity correlation to the VIX remains above that of the IP and S&P 500. The upward status of the hedged equity line through the range of down markets represents a greater sensitivity to extreme volatility moves and, therefore, functional diversification against the more poorly performing IP and S&P 500. If these negative S&P 500 moments represent risk-adjusted return drag for equities and the IP, the aggregate effect explains why the Sortino ratio of hedged equity exceeds that of the Sharpe ratio and why there has been such dissatisfaction with asset allocation during stress events.
Figure 5
Hedged Equity and IP with Similar Performance But Differing Risk Adjusted Returns
| S&P 500 | Hedged Equity (Net of Fees) | Institutional Portfolio | |
|---|---|---|---|
| Total Return | 105.07% | 41.99% | 47.75% |
| Annualized Return | 15.53% | 7.30% | 8.16% |
| All Volatility | 15.15% | 5.14% | 8.39% |
| Downside Volatility | 13.11% | 5.00% | 8.46% |
| Sharpe | 1.02 | 1.42 | 0.97 |
| Sortino | 1.18 | 1.46 | 0.96 |
| Risk Neutral Rate of Return3 | 15.53% | 21.50% | 14.74% |
Source: Easterly EAB. Time Period Jun 20th, 2016, through June 11, 2021
3 Scaled SPX and VIX levels and 6-time intervals for with negative SPX (60-day) linear regression slope. Selection of six ranges (light pink color) is based on choosing trading intervals in which the long-term (60-day) linear regression fit to SPX exhibits negative values or in other words negative slope of linear fit. We shift the SPX 30 days to the left of the negative slope region to provide the context to our analysis. The most recent trading range with negative SPX regression slope (in 2020) is extended to include some range of positive regression trend with no loss of generality for our analysis.
While the raw performance of the IP and Hedged Equity are similar, this analysis (see Figure 5) explains why Hedged Equity is a powerful diversifier, especially during periods of market stress. Despite the IP’s greater correlation to equities, its risk neutral rate (see appendix) of return underperforms Hedged Equity significantly⁴. This is evident when one sees the Sharpe and Sortino benefits of Hedged Equity despite a strong equity environment. If this occurs during a strong period for equities, it would only be logical to believe the noted risk adjusted return improvement of Hedged Equity in a bear market would be much more significant. The idea that the use of a managed correlation approach can offset greater Beta exposures elsewhere and still outperform an institutional asset allocation looks to have important implications for portfolios going forward. It is clear from the analysis that diversification is not a panacea, but utilizing managed correlation approaches, like Hedged Equity, that possess the specific characteristics that investors are targeting when they choose to diversify, can be strongly beneficial.
4 The risk neutral rate of return is the hypothetical return of the portfolio if it was run at the same level of risk as the S&P 500. Neutral Rate of Return doesn’t include financing. Annualized Volatility data is calculated using monthly returns as industry practice.
The Outperformance of Hedged Equity’s Sortino and Sharpe Ratios Matter
For most of the volatility minimization approaches that linearly or inconsistently manage their correlation to the S&P 500, we would argue that Sortino and Sharpe ratios prove difficult to use or compare as the ratios may be the result of timeframes analyzed or other active bets. As the managed volatility class targets diversification and risk management, we believe solid Sharpe and Sortino ratio analysis must be confirmed with predictably exhibited correlation patterns. We would extend that concept for the IP and its components. While the IP is allocated ~41% to equities, the portfolio correlations typically run above 80% (see figure 1). However, when evaluating the absolute and risk adjusted returns of the IP, it clearly underperforms. The Sortino ratio for the IP (see figure 5) shows there is little drawdown benefit, underperforming both the S&P 500 and Hedged Equity.
Conclusion
Correlation management provides a powerful diversifier to equity correlation risk that plagues portfolios. As many studies have focused on long term return periods that can be characterized as bull markets, there is a disconnect with the basic premise of diversification – the smoothing out of equity deep decline risk. If an investor is targeting maximum return, one would not diversify away from equity and equity-like assets. Therefore, we theorize that maximizing the defensive utility of a diversified portfolio is the only viable reason for diversification. In that case, the data shows that the Hedged Equity addition to the Institutional Portfolio is of significant value at overcoming the tendency for asset allocation portfolios to increase equity correlation risk under stress.
Key Findings
- Standard diversification takes a static view of betas and correlations as being true to their long-term averages. We know that this assumption is false, and is a major reason why standard asset allocation, long/short and other forms of risk-managed approaches often fail under stress.
- While Hedged Equity looks like a return dampener, in a blended portfolio looking for resiliency, it is not. This is because it allows portfolios to allocate more greatly to higher Beta and higher-return allocations, such as those in various private markets vehicles and concentrated strategies. We also find that once the initial equity declines occur, the Hedged Equity optionality and put position monetization allows for outperformance even as the equity market starts recovering.
- Conceptually, in the same way that Hedged Equity manages correlation in market stress events, there are opportunities to harvest correlation, or Beta expansion, that would likely also add to the robustness of portfolios. It is clear from the results of this analysis that any approach that can provide dependable correlation patterns to equities and standard diversified allocations, but can also respond positively to VIX increases, would provide similar benefits as a component of those portfolios. This is more important than optimizing to long term average volatility and correlation forecasts.
- Finally, it also should be noted that the Hedged Equity performance was defensive in each of the studied six regimes even if the level of responsiveness was not exactly the same. The combination of risk increase (VIX spike) versus equity decline, clearly impacts the dimension of return improvement. Interestingly, the defensive characteristics however remained in place providing a lower degree of correlation as declines ensued. We believe that makes the case for systematic hedge positioning versus discretionary hedging. One cannot know when events will occur, so being consistently and systematically positioned is a key component to diversification.
Appendix
Easterly EAB Hedged Equity Approach: The US Large Cap Hedged Equity composite invests in the US stock markets going long with S&P 500 based ETFs and a total return swap on S&P 500 based ETFs and hedged using S&P listed (near to 6-week expiry) put and call options in a put spread collar structure to hedge portfolio downside risk. The portfolios allow up to 30% leverage and 150% downside put spread coverage.
Institutional Portfolio (IP): An institutionally-oriented asset allocation mix containing the following blend of asset and sector approaches. (See table below). While there is a broad range of allocation methodologies that often lead to somewhat different weightings, we think the utilized blend falls well within accepted ranges for consultant-recommended and institutionally-utilized asset allocations. The Institutional Portfolio was rebalanced annually in the data set to allow customary drift but at the same time reasonably approximates how a real-world committee would reset allocations to manage risk. Institutional Portfolio components use recognized indices or ETFs as publicly available.
| US Equity | Global ex- US Equity | EM Equity | US Fixed Income | Global Fixed Income | US High Yield | Balanced | Real Estate | Hedge Funds | Other Alts | Cash |
|---|---|---|---|---|---|---|---|---|---|---|
| 24.00% | 13.00% | 4.40% | 20.00% | 1.00% | 8.90% | 0.70% | 5.50% | 1.50% | 18.10% | 2.90% |
Source: Easterly EAB and Bloomberg
Optimization of the Institutional Portfolio and Hedged Equity – Standard Optimization and Monte Carlo Probability Distributions.
To test the hypothesis of whether Hedged Equity improves the diversification benefit of the Institutional Portfolio in declining markets, we performed an optimization using high volatility regime periods. The optimization focused on finding the percentage of Hedged Equity, when added to the Institutional Portfolio, most reduced the risk of drawdowns (see Figure 6). As one can see, adding Hedged Equity provides better results across a range of allocations, but there is a visible tightening in the 30-40% allocation range. This reflects the importance of correlation dampening strategies when many of the underlying assets in the Standard Portfolio experience correlation expansion. To understand the implications of this optimization, we have performed a Monte Carlo analysis to arrive at return probability distributions for the Institutional Portfolio and the portfolio including Hedged Equity for a hypothetical one-year volatility regime-oriented period.
Figure 6
Hedged Equity – Standard Portfolio Optimization
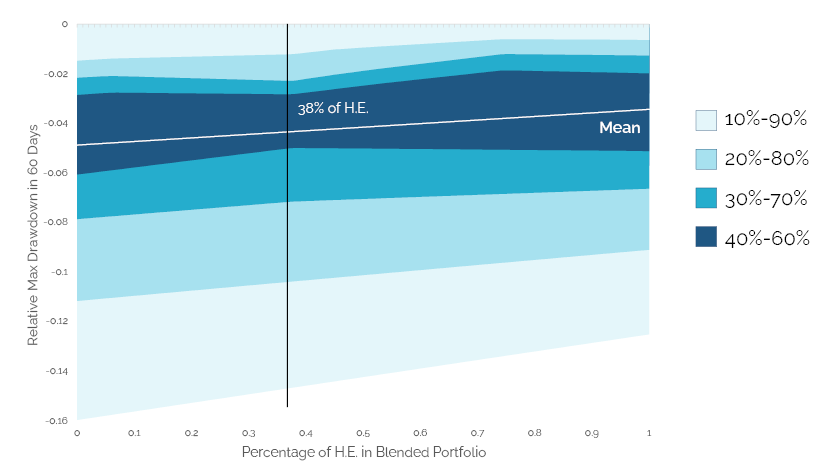
Source: Easterly EAB, using 5 years of data6
Distribution of Max Drawdown as Function of Allocation to Hedged Equity in Blended Portfolio.
5Grossing up the returns of Hedged Equity and the Institutional Portfolio to SPX levels of volatility.
6We chose a one-year period as it is a reasonable bear market approximation, even though it is certainly possible for such markets to last multi-year. Nonetheless, the results of the simulation show the evident benefits of Hedged Equity’s characteristics.
To highlight the benefits of correlation management, an optimization was performed to demonstrate the power of downside beta management. While we are well aware that a 38% allocation to a single strategy presents practical challenges, the optimization nonetheless shows the benefit of Hedge Equity characteristics. A 38% Hedged Equity allocation to the IP tightened the range of approximately one standard deviation results (the 40%-60% range of max drawdowns) seen over rolling 60-day periods. As the range is visually crimped at about 38%, this is viewed as the optimal allocation to minimize max drawdowns. It is also clearly visible that as the allocation to Hedged Equity increases, the range of max drawdown tightens, and the mean decreases, as shown by thesolid black line.
Monte Carlo analysis and probability distributions show the benefits of adding Hedged Equity to the IP in terms of overall performance, drawdowns, and tightening of expected return ranges.
Figure 7
Profit Realization Percentiles 25% to 75% Over Simulated 1Y
Source: Easterly EAB
The one-year bear market simulation shows that the blended portfolio (see Figure 7) starts to improve the range of return within months, particularly relative to the IP.
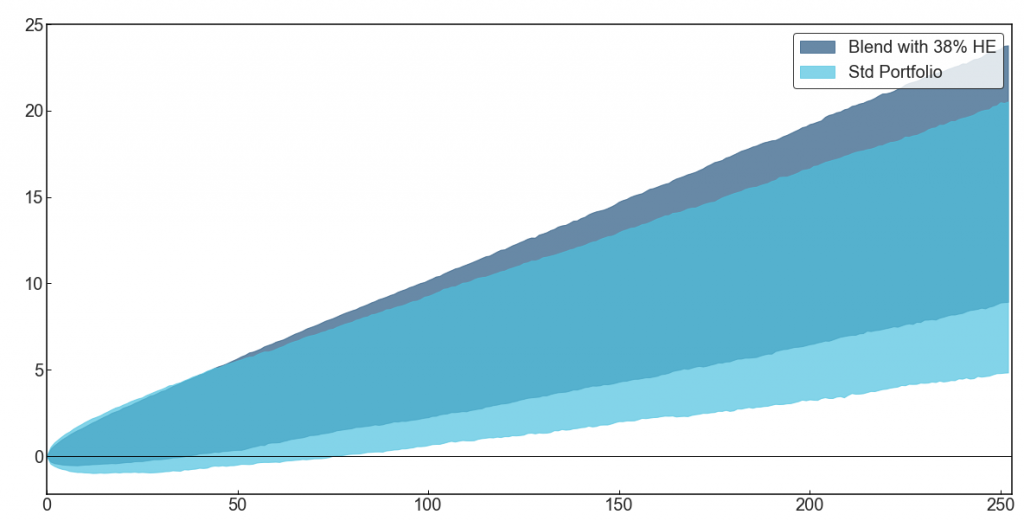
Figure 8
First 50 Scenarios Over Simulated 1Y For Blend with 38% H.E.

Source: Easterly EAB
Another way to look at the simulation is to examine the first 50 scenarios (figure 8) to get an idea what possible performance paths could look like. As one examines these paths for the IP along with the blended portfolio one sees a tighter distribution for the blended portfolio relative to the IP which possesses the potential for “rogue” tail-oriented paths not present with the blended portfolio.
Figure 9
First 50 Scenarios Over Simulated 1Y For Std Portfolio
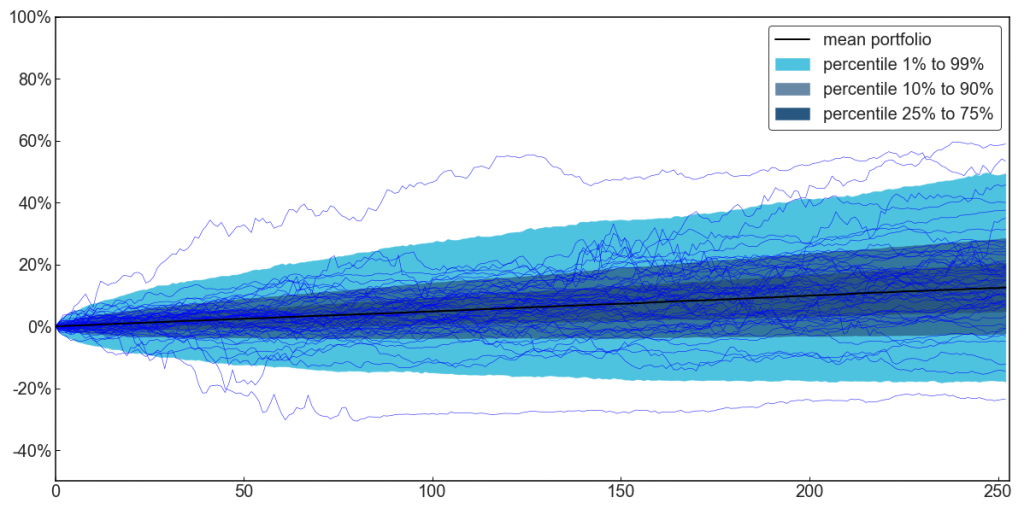
Figure 10
Probability Distribution For Portfolio Annual Returns
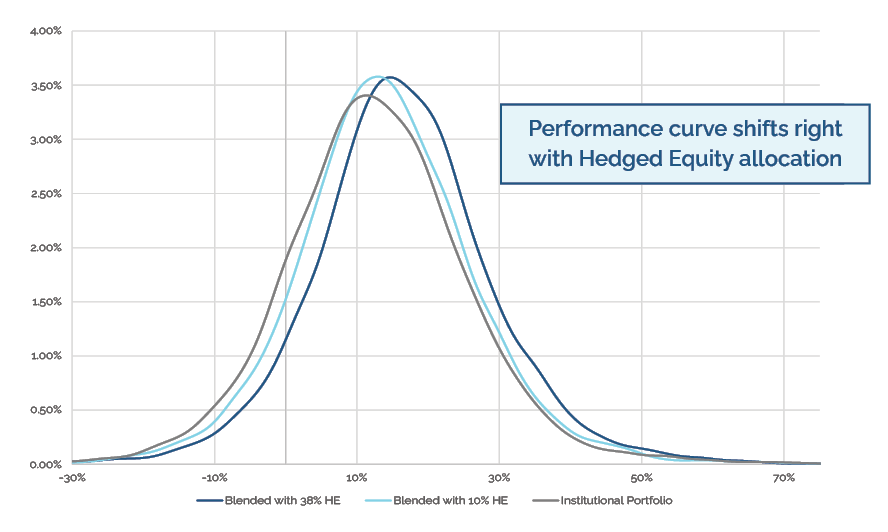
Using a robust 10,000 sample scenario run, the benefits of allocating to Hedged Equity are clear, on average, with a reduction in the depth and number of drawdown occurrences. This leads to the performance curve shifting to the right, connoting better returns and lower drawdowns (see Figure 10) with the Institutional Portfolio having the tendency to produce extreme and unstable downside occurrences not seen in the blended portfolio. The fact that the simulation shows higher upside under stress scenarios counters the common belief that using Hedged Equity reduces return and alpha while muting volatility compared to a standard asset allocation.
Disclosures
All information herein is from sources generally available to the public and believed to be reliable but have not been independently verified. No representation or warranty can be given with respect to the accuracy or completeness of the information, and is subject to updating, revision, and amendment. Easterly EAB Risk Solutions LLC (“Easterly EAB”) disclaims any and all liability relating to this information, including without limitation any express or implied representations or warranties for statements contained in, and omissions from, this information. Subscribers to any service provided by Easterly EAB should consult their own financial advisors, legal counsel, and accountants as to financial, tax, legal, and related matters concerning their subscription to Easterly EAB’s service. No part of this presentation constitutes financial, tax, or legal advice. Easterly EAB reserves the right to modify its current investment strategies and techniques based on changing market dynamics or client needs. The information provided in this report should not be considered a recommendation to purchase or sell any particular security.
This communication also contains forward-looking statements, which reflect the views of Easterly EAB. These forward-looking statements can be identified by reference to words such as “believe”, “expect”, “potential”, “continue”, “may”, “will”, “should”, “seek”, “approximately”, “predict”, “intend”, “plan”, “estimate”, “anticipate” or other comparable words. These forward-looking statements or other predications or assumptions are subject to various risks, uncertainties and assumptions. Accordingly, there are or will be important factors that could cause actual outcomes or results to differ materially from those indicated in these statements. Should any assumptions underlying the forward-looking statements contained herein prove to be incorrect, the actual outcome or results may differ materially from outcomes or results projected in these statements. Easterly EAB and its affiliates do not undertake any obligation to update or review any forward-looking statement, whether as a result of new information, future developments or otherwise, except as required by applicable law or regulation.
The S&P 500 Index consists of 500 stocks chosen for market size, liquidity, and industry group representation. It is a market-value weighted index (stock price times number of share outstanding), with each stock’s weight in the Index proportionate to its market value. The S&P 500 is one of the most widely used benchmarks of US equity performance. Options involve risk and are not suitable for all investors. Prior to buying or selling an option, a person must receive a copy of Characteristics and Risks of Standardized Options. No statement contained herein should be construed as a recommendation to buy or sell a security or futures contract or to provide investment advice. Supporting documentation for any claims, comparisons, statistics or other technical data in this document is available from Easterly EAB upon request. Easterly EAB is a registered investment adviser. Registration does not imply a certain level of skills or training.
More information about the firm, including its investment strategies and objectives, can be found in Easterly EAB Risk Solutions LLC ADV Part 2, which is available, without charge, upon request. This information has been prepared solely for informational purposes for institutional investors only. This information is for the use of the intended recipients only; it may not be reproduced or disseminated, in whole or in part, without the written consent of Easterly EAB.